WMO Aircraft-based Observations Newsletter - Volume 21, April 2021

Welcome to the AMDAR Newsletter April 2021On behalf of the WMO Joint Expert Team on Aircraft Based Observing Systems (JET-ABO), Chairman Curtis Marshall and Vice-Chairman Stewart Taylor, I welcome you to the April 2021 edition of the WMO AMDAR Observing System Newsletter. Firstly, we hope you are safe and well in this challenging time of COVID-19. To all my AMDAR colleagues in both the aviation and meteorological communities, I offer a heartfelt thank you for your valuable work and support to ensure flight safety and provide weather support in these unprecedented and difficult times. You are all to be commended for your diligence and perseverance in moving the ABO program forward using new and creative collaborative methods. Although the crisis has deepened due to a second pandemic wave and delays in vaccination, exciting new opportunities are on the horizon. 2021 is poised to be a first step towards a new, safe and efficient aviation industry where technology, sustainability and safety are the pillars of aerial transport. Significant changes have taken place in the structure of WMO expert team on aircraft-based observations. The team, now the Joint Expert Team on Aircraft-Based Observing Systems (JET-ABO) is jointly managed by the Standing Committee on Earth Observing Systems and Monitoring Networks (SC-ON) and the Standing Committee on Measurements, Instrumentation and Traceability (SC-MINT) both under the Infrastructure Commission (INFCOM). The team membership, made of member experts and also including representation from the International Civil Aviation Organization (ICAO), the Association of Hydro-Meteorological Equipment Industry (HMEI) and the International Air Transport Association (IATA), are contributing to the work program aimed expanding and enhancing a range of aircraft-based observing systems that, in addition to AMDAR, includes other ABO sources including Mode-S, ADS-C, FLYHT data and Uncrewed Aircraft Systems (UAS). In December 2020, the first in a planned series of JET-ABO teleconferences was held. Several main topics such as the workplan, WICAP implementation and resourcing were discussed as well as alternative ABO sources and joint work with IATA. During the next few months, the JET-ABO also will participate in several WMO-organized conferences and meetings to ensure the ABO program is represented within and coordinated through the efforts of WMO members and our partners. Included in this edition of the newsletter are short articles on a variety of topics including more details on the upcoming activities of the JET-ABO, WICAP, updates on turbulence and water vapor measurements and UAS as well as regional updates on ABO activities. As always, we welcome your feedback and questions on these articles, or inquiries on any other ABO-related matters. nrivaben |

Status of Aircraft-Based Observations & COVID-19 ImpactThe graphic below shows the smoothed, monthly average of daily aircraft-based observations (single point measurements in space and time, mainly of air temperature and wind speed and direction, made by an aircraft) transmitted on the World Meteorological Organization (WMO) Global Telecommunications System (GTS) since 2007 up to March 2021, as contributed by:
The observations from the WMO AMDAR observing system are the output from 12 operational AMDAR national and regional programmes in cooperation with some 43 national and international participating airlines, as listed on the WMO website. |
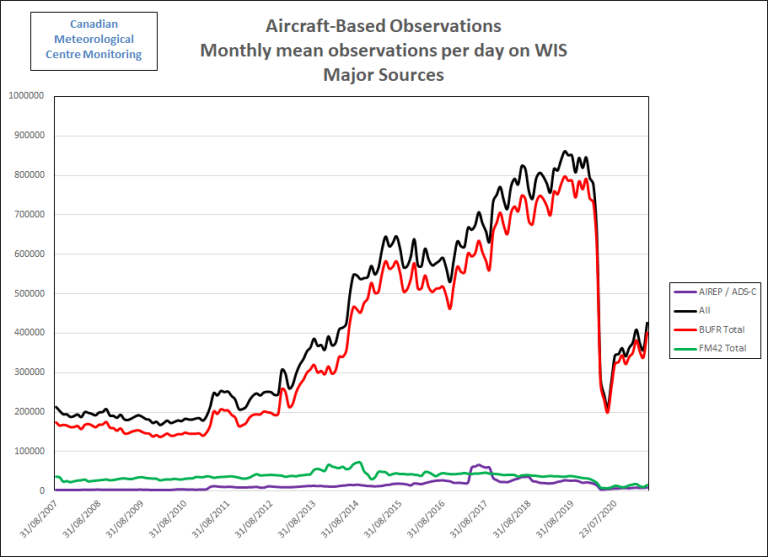
ABO Data Volumes, Coverage and Impact of COVID-19The graph shows that recently towards the end of 2019 and start of 2020, aircraft-based observations data volumes had increased to a historical maximum of more than 850K observations per day on the GTS, with AMDAR observations making up the majority of these at around 750K observations per day. From March 2020 as a direct result of the impact of the COVID-19 impact on the aviation industry and airlines the volume of aircraft-based observations overall fell to around 245K observations per day and to 230K for AMDAR - around 30% of December data volumes for both. |
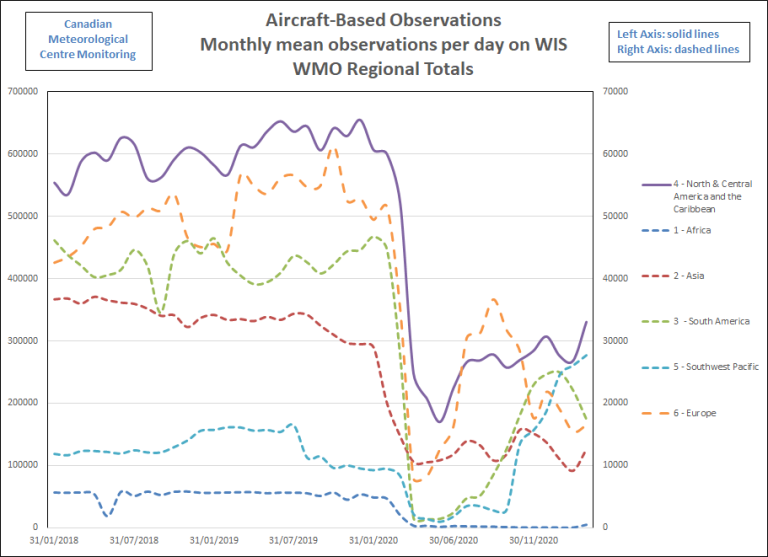
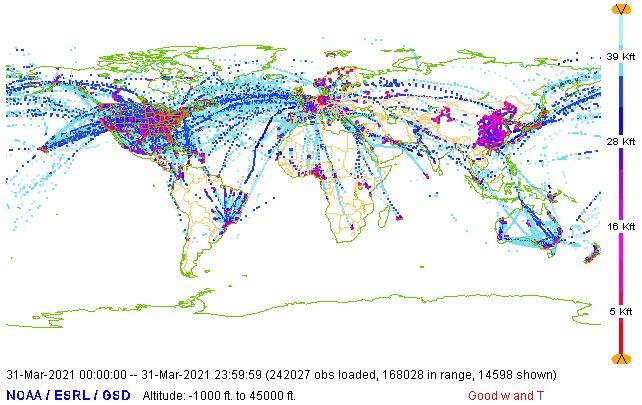
Since then, and as can be seen on the graphic above, showing ABO mean monthly data volumes by WMO regions, data levels have gradually increased overall in most regions, but have fluctuated markedly in line with the varying impact of the COVID-19 crisis on airline and aviation operations in countries within each region. As of end-March 2021, ABO data levels on the GTS are at around 425K observations per day with an expectation to gradually increase over the coming months as countries and regions emerge from the crisis and aviation operations start to increase accordingly. While the coverage as depicted below, showing the 24 hour period at 31 March 2021, has improved somewhat to that shown in the last newsletter for October 2020, most of the data volume increase is over the USA, with a small increase in some other regions. |
More information on the regional and national impacts of the crisis that is severely impacting the aviation industry and, as a result, the ABO programme is available in the article on WMO regional programs. Thanks to Program PartnersWMO and its Members are grateful to our aviation industry and airline partners for their continued contribution to the WMO Aircraft-based Observing System and the AMDAR Programme. The data that are produced from this collaboration are utilized within many meteorological applications and forecasts, benefiting aviation operations and safety, other application areas and the wider general public. For more information on aircraft-based observations data statistics visit the WMO Community Platform Aircraft-Based Observations site. |
ABOP Water Vapor MeasurementGlobal Water Vapor Measurement SummaryOperational Water Vapor Measurements (WVM) within the Aircraft Based Observations Programme (ABOP) continue to be sustained by the few participating Members implementing the Water Vapor Sensing System (WVSS-II). The current worldwide network of ABOP aircraft reporting WVM with WVSS-II remains at 148 which is unchanged since our last report in October 2020. While the COVID-19 pandemic has impacted the availability of data from WVM reporting aircraft, their accessibility has been notably higher in the U.S. where the network includes a diversity of aircraft types and airline partners. Despite the reduction in data quantities, these in-situ upper-air observations continue to be extremely valuable in all forecast operations, especially numerical weather prediction, and provide a significant contribution to the Global Observing System. From the perspective of equipped aircraft, RA-IV remains the leading network implementation of WVSS-II through the U.S. National Oceanic and Atmospheric Administration (NOAA) / National Weather Service (NWS) Public Private Engagement program with Collins Aerospace. The RA-VI WVSS-II network from EUMETNET ABO (E-ABO), in cooperation with Lufthansa Group, remains at nine WVSS-II-equipped aircraft in the fleet. Details on each regional implementation programme are found below. The table below shows the number of WVSS-II reporting aircraft across all WMO Regions. 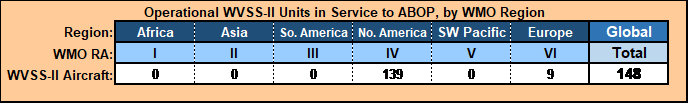
The TAMDAR sensor is an additional source of WVM data that provides RH measurements primarily over North America and the South-West Pacific WMO Regions. There are currently 328 TAMDAR units installed on aircraft globally with only 127 of these aircraft currently active. The table below shows the number of TAMDAR reporting aircraft across all WMO Regions.
Current global number of aircraft reporting RH via TAMDAR organized by contributing WMO Region. Similar to other ABO data, TAMDAR has been impacted significantly by COVID-19. Although numbers are beginning to rebound, the TAMDAR sounding counts are roughly a quarter of pre-COVID-19 totals and the number of daily reporting aircraft is roughly a third lower compared to pre-pandemic levels. The image below shows where TAMDAR observations were collected for a one-week period in early March of 2021. | |||||||||||||||||||||||||||||||||||||||||||||||||||||||
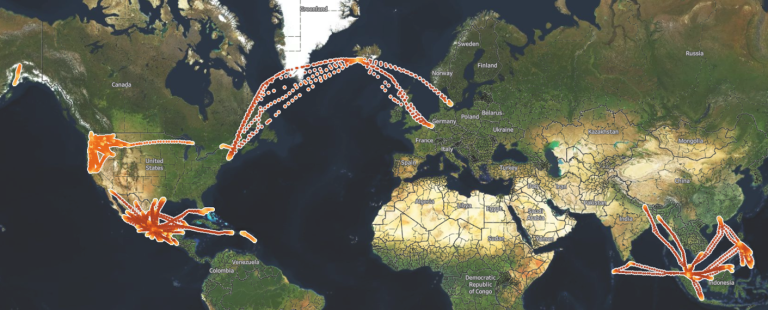
As the airline industry begins to rebound, the largest increase in TAMDAR-equipped flights will be over the South-West Pacific and Asia regions. U.S. NWS WVSS-II Program Continues Support for ABOP WVMThere are currently 139 WVSS-II-equipped aircraft operating in the U.S. ABOP network. This airline partner network serve many countries in RA-IV on a routine basis as well as providing occasional profiles in neighboring regions. Thus, the U.S. WVSS-II network supports forecasting operations for all countries throughout the region resulting in increased aviation safety for everyone. The larger U.S. network of WVSS-II-equipped B757 and B737 aircraft has been able to minimize the impacts resulting from COVID-19, operating at approximately 50% to 90% of 2019 levels during much of the pandemic. This has been made possible through active collaboration between the U.S. WVSS-II data service provider, Collins Aerospace, and the participating airline partners, UPS and Southwest Airlines. This collaboration has yielded the maximum possible availability of data from the three types of WVSS-II-equipped aircraft thereby minimizing the overall impact to ABO operations during the pandemic. | |||||||||||||||||||||||||||||||||||||||||||||||||||||||
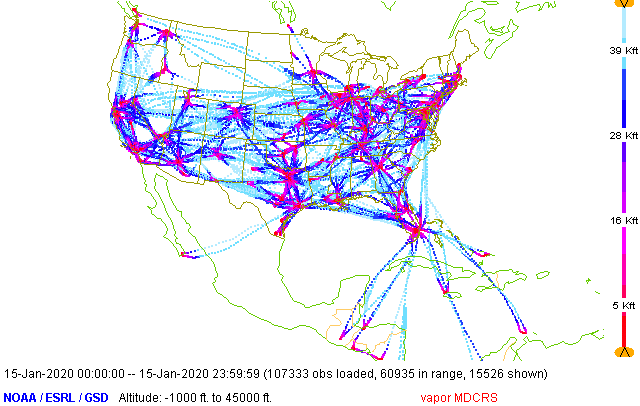
24 hours of WVSS-II data from the U.S. Network in Sep 2019. (Graphic courtesy of NOAA/ESRL/GSD) | 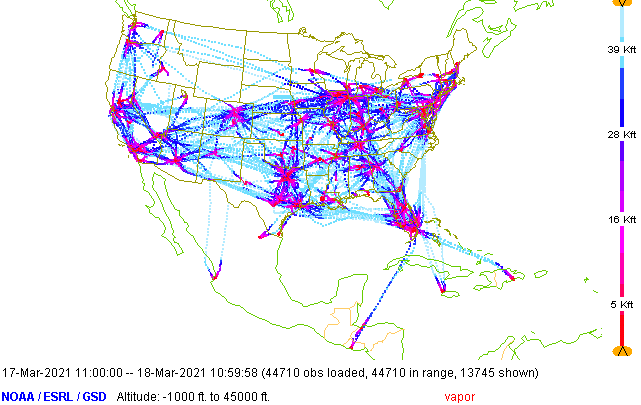
24 hours of WVSS-II data from the U.S. Network in Mar 2021, during COVID-19. | ||||||||||||||||||||||||||||||||||||||||||||||||||||||
E-ABO Reporting of WVM with WVSS-IIGermany E-ABO/DWD and airline partner Lufthansa Group continue to operate the initial network of nine WVSS-II-equipped A321 aircraft within the E-ABO network. Unfortunately, the COVID-19 pandemic continues to cause travel restrictions within Europe resulting in these slightly larger capacity aircraft remaining out of service. Consequently, the E-ABO WVM programme has been severely impacted with only a few flights of the WVM-equipped aircraft occurring in the recent months of the pandemic. United Kingdom While the plans have slowed due to the COVID-19 pandemic, the Met Office, UK intends to proceed with an initial implementation of 30 WVSS-II installations on UK-based aircraft starting in 2022/2023. These implementations are in support of the expansion of observations necessary for the Met Office Numerical Weather Prediction infrastructure upgrades. Programme approval has been granted and discussions with airline partners are currently underway. The WMO JET-ABO WVM Team | |||||||||||||||||||||||||||||||||||||||||||||||||||||||
Aircraft-based Turbulence Observations Status within AMDARThere are two atmospheric turbulence intensity metrics currently in use by the AMDAR community. The first metric is eddy dissipation rate (EDR). MacCready (1964) first suggested the use of EDR as a measure of turbulence intensity. It is particularly useful operationally since EDR along the vertical direction is proportional to the RMS (root-mean-square) vertical acceleration experienced by an aircraft for any given flight condition (MacCready 1964; Cornman et al. 1995). Further, EDR has been adopted as the standard metric for atmospheric turbulence reporting by the International Civil Aviation Organization (ICAO) (2001). Before the COVID-19 pandemic, more than 1300 aircraft were reporting EDR worldwide with an average of approximately 80,000 reports per day as of February 2020. However, as seen in Figure 1 which shows the approximate numbers of available routine EDR reports, beginning in March, a swift decline in the numbers of flights caused a drop in the EDR reporting to about 30% of pre-COVID-19 levels. Since then, reporting has recovered slowly to about 85% of pre-pandemic levels. Figures 2, 3, and 4 show the locations of available EDR reports for September 2019 (before COVID-19), April 2020 (during the decline in reporting), and March 2021 (the most recent month) respectively. Currently, more than 1300 aircraft are reporting EDR worldwide with an average of approximately 75,000 reports per day. Since the number of reporting aircraft is now about the same as before the pandemic began, the lower reporting levels is likely due to an overall decrease in the number of flight hours. |
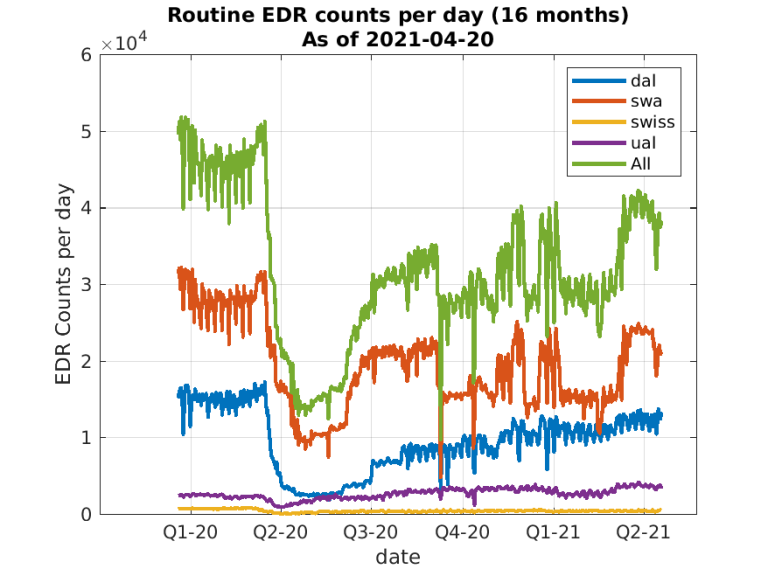
Figure 1: Counts of all available routine EDR reports per day for the previous 16 months, as of March 20, 2021, broken out by reporting airline. |
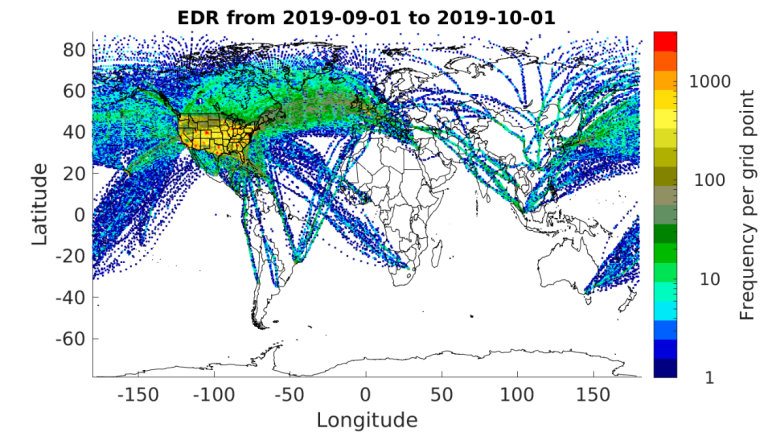
Figure 2: Counts of all available EDR reports for September 2019 (pre-COVID-19) using an approximately 50x50 km grid. The color scale is logarithmic. |
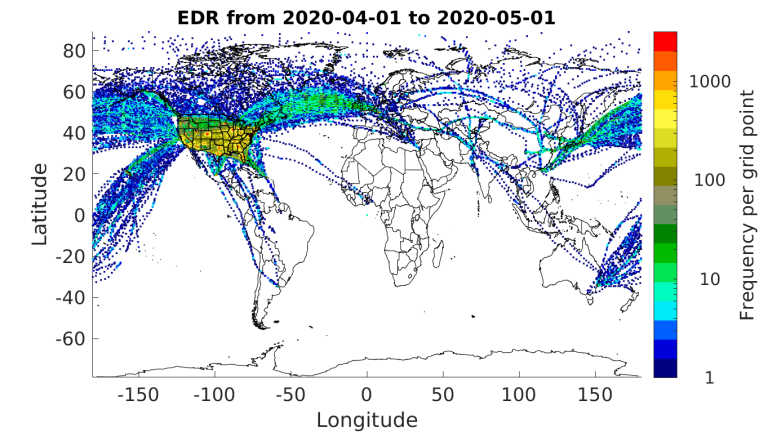
Figure 3: Counts of all available EDR reports for April 2020 (during the COVID-19 decline) using an approximately 50x50 km grid. The color scale is logarithmic. |
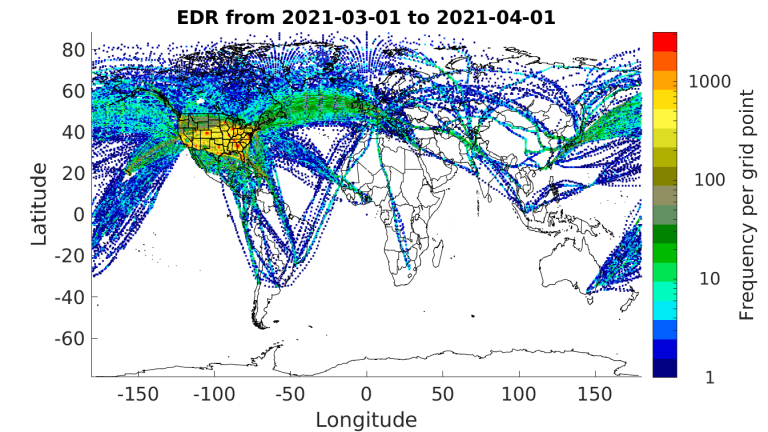
Figure 4: Counts of all available EDR reports for March 2021 using an approximately 50x50 km grid. The color scale is logarithmic. |
The second metric, derived equivalent vertical gust (DEVG), is defined as the instantaneous vertical gust velocity which, superimposed on a steady horizontal wind, would produce the measured acceleration of the aircraft. The effect of a gust on an aircraft depends on its mass and other characteristics, but these factors are accounted for so that a gust velocity can be calculated which is independent of the aircraft. Before the impacts of COVID-19 were truly felt by the aviation industry, more than 360 aircraft were reporting DEVG worldwide averaging about 20,000 reports daily. Starting in early March of 2021, DEVG reporting also dropped significantly, down to about 15% of pre-COVID-19 levels. These numbers are based on an analysis of AMDAR data from The U.S. National Centers for Environmental Prediction’s (NCEP) Meteorological Assimilation Data Ingest System (MADIS). A large fraction of the DEVG data appears under a few tail numbers, which is unrealistic, and thus the estimated number of aircraft reporting DEVG is substantially underestimated. Currently, there are at least 130 aircraft reporting about 31,000 measurements per day (about 155% of pre-COVID-19 levels). The source of the dramatic increase is currently under investigation. It appears to be coming from a twofold increase in the number of reports below 5000 feet in Australia and New Zealand. Figures 5, 6, and 7 show the locations of all DEVG reports for September 2019, April 2020 and March 2021, respectively. There is software-based logic implemented on many aircraft that limit reporting of DEVG in some regions at certain altitudes (e.g., Europe). DEVG reporting has grown over North America but has dropped precipitously over the southern hemisphere. |
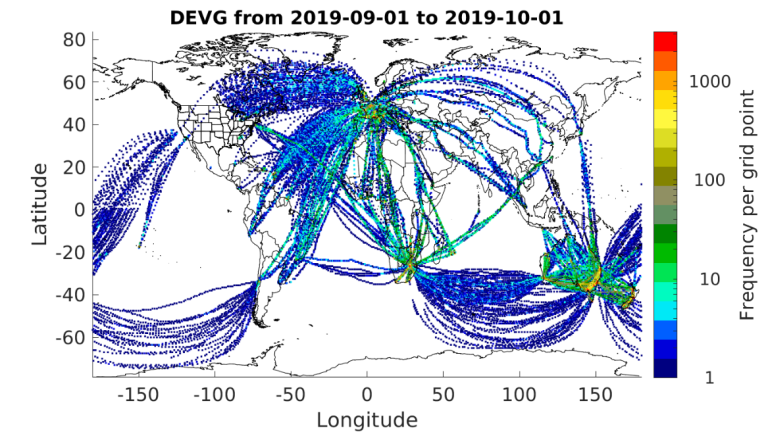
Figure 5: Counts of all available DEVG reports for September 2019 using an approximately 50x50 km grid. |
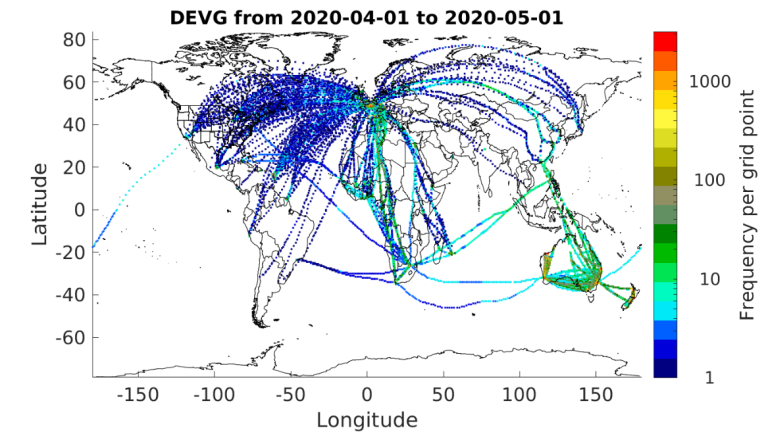
Figure 6: Counts of all available DEVG reports for April 2020 using an approximately 50x50 km grid. |
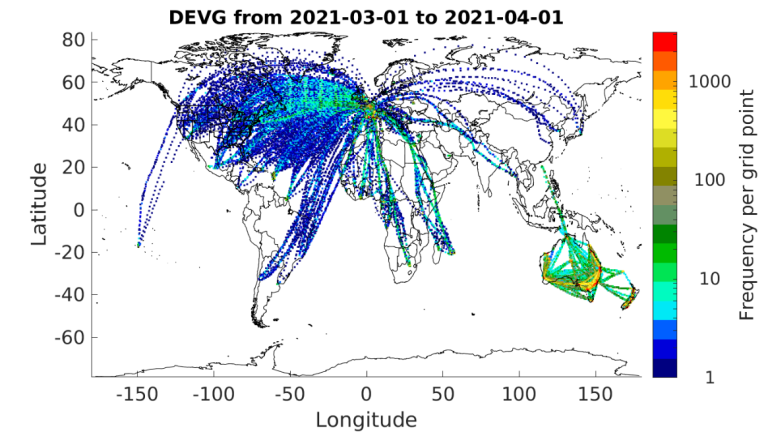
Figure 7: Counts of all available DEVG reports for March 2021 using an approximately 50x50 km grid. |
These maps illustrate the need for expansion of aircraft-based turbulence observations in many areas of the globe. WMO continues to work with its Members and their respective national airlines to increase aircraft-based turbulence observation coverage. WMO and its Members express gratitude to our aviation industry and airline partners for their continued contribution to the WMO Aircraft-based Observing System and the AMDAR Program. The data produced from this collaboration are utilized within many meteorological applications and forecasts benefiting aviation operations and safety, other application areas and the wider general public. For more information on aircraft-based observations data statistics visit the WMO website. meymaris |
Regional Programme Status and DevelopmentsWMO Region II (Asia) – ABO StatusChina AMDAR To facilitate data exchange and data processing by downstream users, China AMDAR data have been disseminated in BUFR format via Global Telecommunication System (GTS) since 22 December 2020 (under the GTS headers 'IUAD01 BABJ' and 'IUAH01 BABJ'). With two advance notices, the dissemination of China AMDAR data in FM42 format was ceased on 31 March 2021. Currently, the China AMDAR programme provides approximately 4500 to 6200 upper-air observations daily. yflee WMO Region III (South America) – ABO StatusAs in all countries, the COVID-19 pandemic has severely affected the South American aviation industry. Flights have been reduced to nearly zero due to airspace and border closures. Only special repatriation flights have been allowed. During 2020, the resulting ABO data loss is nearly 83% for Brazil and 99% for Argentina. A steady upturn in flights and reported ABO is expected as vaccinations increase during February and March of 2021. However, with an anticipated second wave of COVID-19 coming to South America, the outcome of the regional aviation industry recovery remains uncertain during Q2 of 2021. During March 2021, the Task Team on Aircraft based Observation for Region III (TT-ABO III) held the first 2021 WMO-IATA Collaboration on AMDAR Program (WICAP) teleconference meeting with national representatives from Argentina, Bolivia, Chile, Paraguay, Peru and Uruguay participating. Regional matters such as ABO-Regional Implementation Program (A-RIP) updates and requirements and 2021 WICAP implementation for RA-III also were discussed. The next meeting is scheduled for April at which task team members will plan the next steps for WICAP implementation with regional IATA representatives. Argentina (AR)-ABO As mentioned, AR-AMDAR has reported a very pronounced decrease and ultimate stoppage in its AMDAR data provision (fig 1.). The COVID-19 pandemic forced the LATAM Argentina branch into bankruptcy and ended the regular AMDAR data provision from this country after June 2020. |
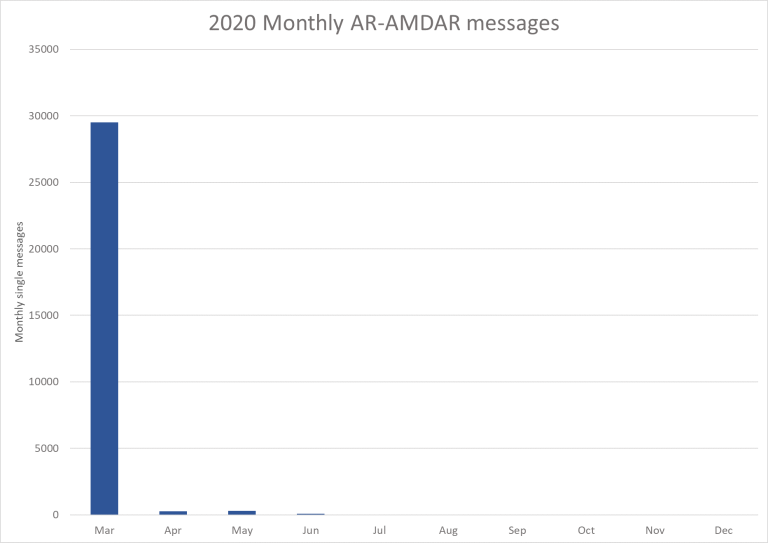
Figure 1. Evolution of monthly AR-AMDAR messages during 2020. Source: SMN Argentina |
Brazil (BR)-ABO The Brazilian ABO program also has not escaped the effects of the pandemic (fig. 2). ADS-C data provision has been severely affected. Since April 2020, ADS-C reports over its Atlantic Flight Information Region (FIR) have remained at 70% below pre-pandemic levels and data from international flights also have been reduced. Conversely, AMDAR data processing has shown a slight increase since May mainly due to an increase in domestic flights. This was the result of a local flexibility in the Brazilian airspace and a partial opening of the local economy. However, airlines continue to struggle with financial issues related to the pandemic and flights have remained at 50% of January 2020 levels. 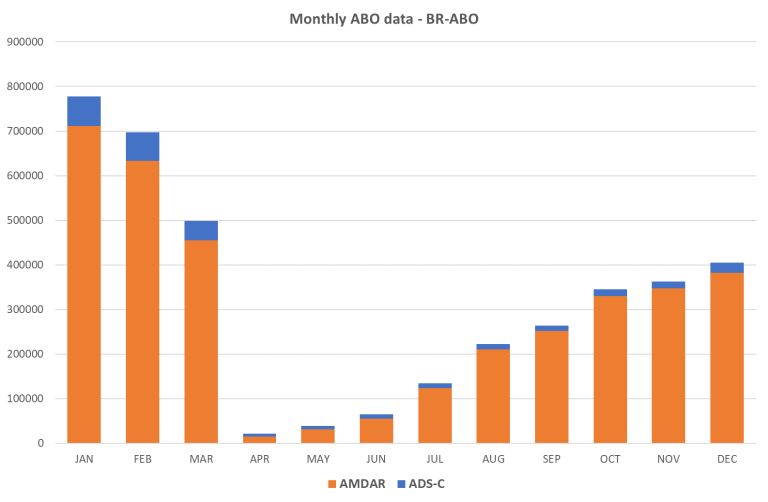
Figure 2. Brazilian ABO program data during 2020. Blue bars represent ADS-C data and orange bars show AMDAR data. Source: Martim Matschinske (CTCEA/CISCEA - Brazil) |
US-LATAM Program Due to pandemic-forced border closures since March 2020, the LATAM program has been seriously affected with nearly no flights occurring between April and May (fig 3). Although a slight increase in flights has been observed since June, ABO data reduction remains between 50% and 60% (fig 4) of January 2020 levels. The U.S. will continue procurement and provision of the LATAM data feed through September 2021. It is anticipated that a new contract will be awarded by September with options to continue data procurement and provision subject to continued availability of funds. |
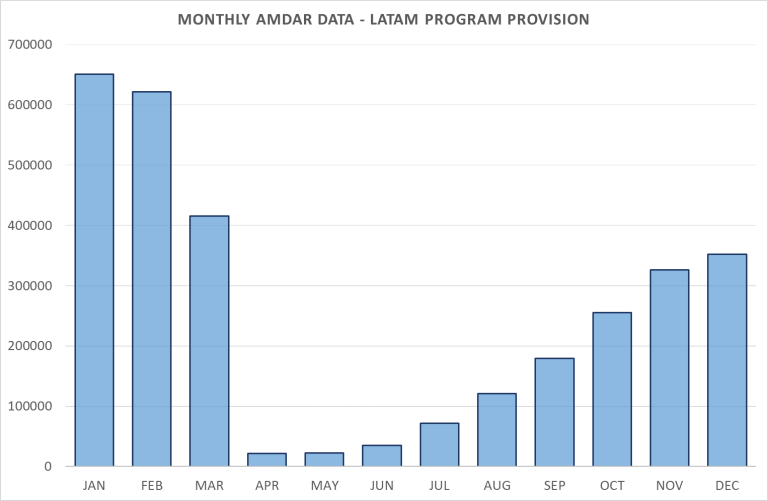
Figure 3. LATAM program. Blue bars represent AMDAR monthly data. Source: Dirección Meteorológica de Chile (DMC) |
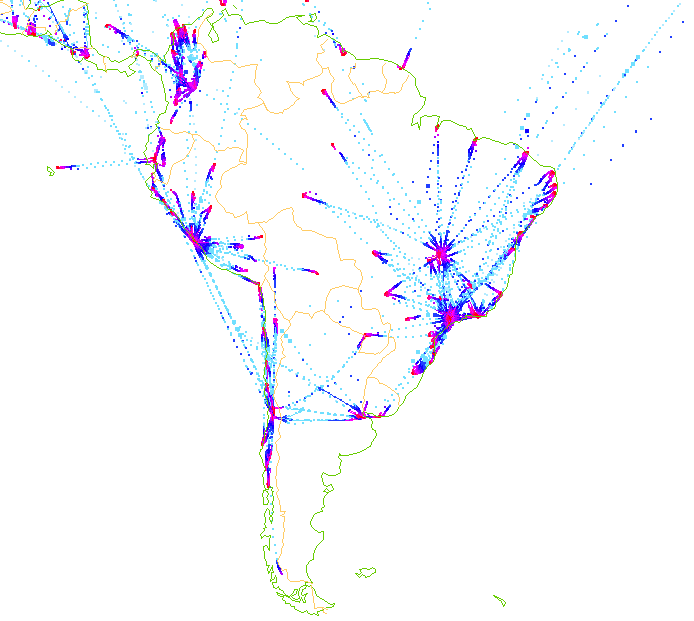
Figure 4. LATAM program coverage on 1 March 2020 between 00:00 and 24:00UTC. Source: NOAA nrivaben |
WMO Region IV (North America, Central America and the Caribbean) – ABO StatusProgrammatic Developments The RA-IV Program consists of the USA and USA-based airlines and FLYHT TAMDAR, Mexico and AeroMexico, and Canada and Canadian data sources from FLYHT. Featured above in this newsletter the reader may find a more detailed article on new Canadian sources of data from FLYHT. The RA-IV program is making progress toward establishment of a regional WMO RA-IV program under the WMO WICAP framework. A Region IV workshop featuring experiences and perspectives on AMDAR will be held on May 18, 2021 with an eye toward assisting and informing those WMO members who currently do not have ABO or AMDAR national programs in establishment and regional collaboration in an RA-IV regional program. COVID-19 COVID-19 has significantly impacted the USA AMDAR program since mid-March 2020. Of the approximately 3500 aircraft providing observations to the US program, at its nadir in spring 2020 slightly more than 1000 were reporting on a weekly basis, resulting in the number of daily profiles fluctuating between 20% and 30% of normal. By late summer of 2020 the volume of data had risen to close to 50% of normal and remained steady at that level, but more recently has begun increasing again, and as of April 2021, air traffic and data volume have increased to 60% of normal. Many of the 135 USA aircraft that supply WVSS data have continued to operate during the pandemic, at a much higher fraction that non-WVSS equipped aircraft. Therefore, the overall volume of WVSS data has remained appreciably near its pre-pandemic normal. |
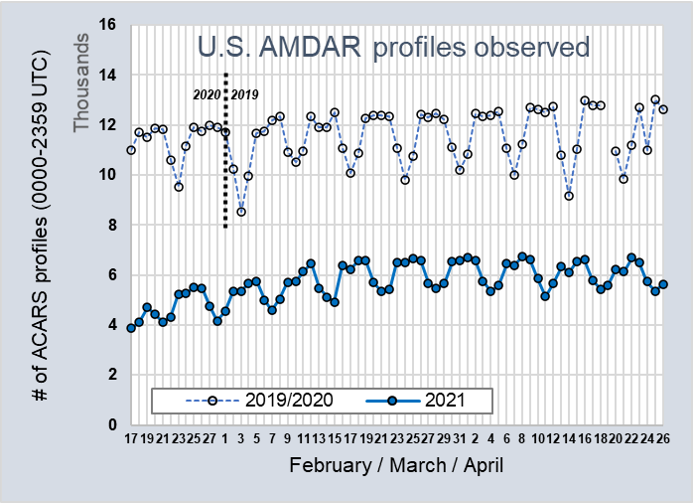
Graphic courtesy of Christopher Hill, NCEP/EMC |
curtis [dot] marshall |
| Return to contents |
Recent Development of the WMO-IATA Collaborative AMDAR Programme (WICAP) | |
| Readers wll be aware that WMO and the International Air Transport Association (IATA) have agreed to work together on the future development and expansion of the AMDAR observing system under a programme known as the WMO-IATA Collaborative AMDAR Programme (WICAP). This article follows on from the previous update on WICAP which was in Volume 20 of the newsletter. | 
|
The INFCOM-I, Part II, Session reviewed the WICAP Data Policy in November 2020 The INFCOM-I, Part II was held online from 9th to 13th November 2020 at which the WMO Members reviewed the WICAP Data Policy and recommended that the next Session of the Executive Council (EC-73) will approve it with the proposed minor editorial changes. After the approval by EC, WMO and IATA are ready to sign the Data Policy, one of the core documents for WICAP operations, and it will be appended to the WMO-IATA Working Arrangement and used as the baseline for the participation agreement between a WICAP Operator and an airline joining the programme. The INFCOM also discussed the WMO membership of the WICAP Governing Board, a decision-making body of WICAP, with a proposal to have two representatives from the WMO Secretariat and two WMO member experts along with the equal representative of four members from IATA. The Commission’s proposal is recommended to be approved by EC-73 in June 2021. The final report of the INFCOM-I, Part II including Recommendation 5 on the Collaboration with IATA WMO-IATA Collaborative AMDAR Programme is available in the WMO Library. Coordination Group on WICAP (CG-WICAP) work under JET-ABO The WMO Joint Expert Team on Aircraft-Based Observing Systems (JET-ABO) has appointed a sub-group of JET-ABO members to coordinate the development and implementation of WICAP, named as Coordination Group on WICAP (CG-WICAP). The Terms of Reference and the assigned membership of CG-WICAP are available in the WMO Expert Database. At the first meeting of JET-ABO in early December 2021, CG-WICAP presented plans and activities for the year 2021 with regional aspects to planning and resourcing. The final report of the meeting consolidates these points (item 3) along with other ABO matters discussed at the meeting. The members of CG-WICAP meet on regular basis to undertake the planned activities according to the CG-WICAP workplan which some of are discussed later in this article. CG-WICAP is reporting their progress back to JET-ABO and the WICAP Governing Board. The first WICAP Governing Board meeting in January 2021 According to the INFCOM recommendation for the procedure of nominating representatives to the WICAP Governing Board, the President of INFCOM with the endorsement of the President of WMO has proposed the WMO membership for the WICAP Governing Board as follows: Mr. Steve Stringer, Programme Manager, EUMETNET, Dr. Curtis Marshall, Aircraft-Based Observations Program Manager, NOAA, Dr. Anthony Rea, Director, WMO Infrastructure Department and Mr. Dean Lockett, Scientific Officer, WMO Observing Networks and Measurement Division. With four representatives from both organizations, the first meeting of the WICAP Governing Board was held online in two sessions of two hours from 18th to 19th January. The Board received the report of the accomplished milestones in 2020 and endorsed several documents such as working practices for the Board, Terms of References for WICAP Oversight, Planning & Coordination Team (OPCT) and for Regional WICAP Operating Centres during the first part of the meeting. The second day was dedicated for discussion on resourcing and planning. The discussion included considerations on potential funding mechanisms for WICAP operations and reviewing communication and work plans for the up-coming years. The key outcomes from the meeting with actions for OPCT and CG-WICAP to undertake are: to specify the priority activities for the year 2021, to launch the discussion on the outline for the WICAP Financial Framework, establishment of the WICAP Risk Register and to develop Communication Strategy. The final report of the meeting is available in the WMO Community Platform. Regional Implementation of WICAP Regional planning and implementation of WICAP has started in the most of the WMO Regions over the past few years. The regional working groups on ABO and WICAP for RA I, III, V and VI are active and are planning regional structure for operation and resourcing of WICAP. Most recently, the RA IV held their 18th Regional Association Session in February 2021 where they decided on the establishment of the regional AMDAR Programme under WICAP. Based on the RA IV Decision, the Region is currently organizing an online Introductory Workshop on ABO and WICAP which will be held on 18th May 2021. The workshop will provide a general introduction to ABO and WICAP and will allow the exchange of experiences based on presentations by various RA IV Members. It will also promote discussion on challenges and opportunities at the regional and national levels, as well as on the possibilities of collaboration between National Meteorological Services and National Civil Aviation Institutions. | |
WICAP Development There are several development activities going on for supporting the establishment and operations of WICAP and for promoting the concept and benefits to the aviation stakeholders. The key activities are listed below: | 
|
| |
The Status and Future of Small Uncrewed Aircraft Systems (UAS) in Operational MeteorologyThis newsletter article summarizes a paper that was submitted for publication in the Bulletin of the American Meteorological Society. The intent of the paper was to assess the current state-of-the-art of small weather-sensing UAS (WxUAS, after Chilson et al. (2019) and Bell et al. (2020)) and to the discuss the potential value of WxUAS in supporting operational meteorology. This value can be realized either by providing new in situ datasets in data sparse regions of the lower atmosphere for use in numerical weather prediction (NWP) or by supplying operational forecasters with up-to-the-minute characterization of rapidly evolving high-impact weather scenarios. What is a small UAS? Here, the term “small UAS” refers to a class of autonomous aircraft weighing less than 25 kg (55 lbs) as defined by the U.S. Federal Aviation Association (FAA) Part 107 regulation (and similar European laws). It should be noted that we have chosen to utilize a gender neutral term, “uncrewed,” when referring to these small autonomous systems. Other terms used to identify these small autonomous aircraft include Unmanned Aircraft (or more broadly, Aerial) Systems (UAS), Remotely Piloted Aircraft Systems (RPAS) and drones to name a few. These aircraft are typically restricted to operating under Visual Line of Site conditions constrained to fly below 120 m (400 ft); however, waivers can be obtained that allow for flights to much higher altitudes, Beyond Visual Line of Site, over semi-urban areas, and, more recently, within cloud layers. Potential Operational Impacts of WxUAS Reducing gaps in the observation of thermodynamic and kinematic properties of the lower atmosphere is critical for achieving more skillful mesoscale predictions of high-impact weather. For example, the U.S. National Oceanic and Atmospheric Administration’s (NOAA) goal of developing a Warn-On-Forecast capability (e.g., Stensrud 2013) hinges on increased observation of the lower atmosphere at space and time scales relevant for accurately predicting hazardous severe weather at the county scale. Temporal and spatial gaps in existing observing systems contribute to model forecast uncertainty (e.g., James and Benjamin 2017; James et al. 2020). In fact, the maximum skill of regional NWP models will not be reached until observations are obtained at space and time scales comparable to their effective resolution (Dabberdt et al. 2005). Operational meteorologists have also pointed to the need for increased observation of the lower-atmosphere to improve short-term (< 8 hour) forecast guidance products (e.g., Houston et al. 2020). Observations of typical state variables (e.g., temperature, moisture, wind) are important but so too are visual observations for monitoring and verification (Houston et al. 2020). Moreover, the dearth of lower-atmospheric observations is particularly significant in less developed regions of the world, making it particularly challenging for both NWP models and meteorologists to produce accurate short-term forecasts of high impact weather events like severe thunderstorms (e.g., Woodhams et al. 2018). Today’s WxUAS are nearly 100% reusable (as opposed to radiosondes), powered with rechargeable batteries using locally-generated solar energy, and extremely adaptable (Elston et al. 2015). The term WxUAS is used here to distinguish between UAS that are dedicated to observing the atmosphere and those that may collect atmospheric data coincidentally while performing some other primary service (e.g., commercial delivery) or private flights. Combined, observations from these systems could provide unprecedented capability to measure space and time variability of the lower atmosphere. Recent development efforts have resulted in the production of a fully autonomous system that can robotically progress through all stages of flight including take-off and landing, profiling, system checks and recharging while accurately measuring the evolution of key atmospheric variables (Figure 1). The time-height cross section shown in Figure 1 was obtained with a Meteomatics WxUAS known as a Meteodrone. The rapid, deep-layer profiling obtained with the Meteodrone captures both sub-hour variability as well as sharp vertical gradients in temperature, humidity, and wind speed (Figure 1). In this case, the rapid cooling in the lowest 500 m AGL led to increased relative humidity values that approached 100% and fog formation over a period of less than 1 hour. Such WxUAS observations have been shown to improve the prediction of radiation fog occurrence using mesoscale data assimilation. But, the adoption of WxUAS by National Meteorological and Hydrological Services will only occur if the value of improved forecasts, particularly those of high impact weather, and resulting augmentation in stakeholder support services far exceeds the cost of implementation. The future of this capability is bright because of massive investments in developing UAS technologies over the past 10 years (Belton 2015; Nath 2020). While the current cost of operating WxUAS (which often are limited to one pilot per UAS and, in many cases, also require human observers to meet sense and avoid requirements) is still relatively high, progress toward widespread autonomous WxUAS flight is being made via allowances for beyond visual line of sight (BVLOS) flight (Jacob et al. 2020) and further advances in the development and demonstration of detect and avoid (DAA) systems (Mitchell et al. 2020). 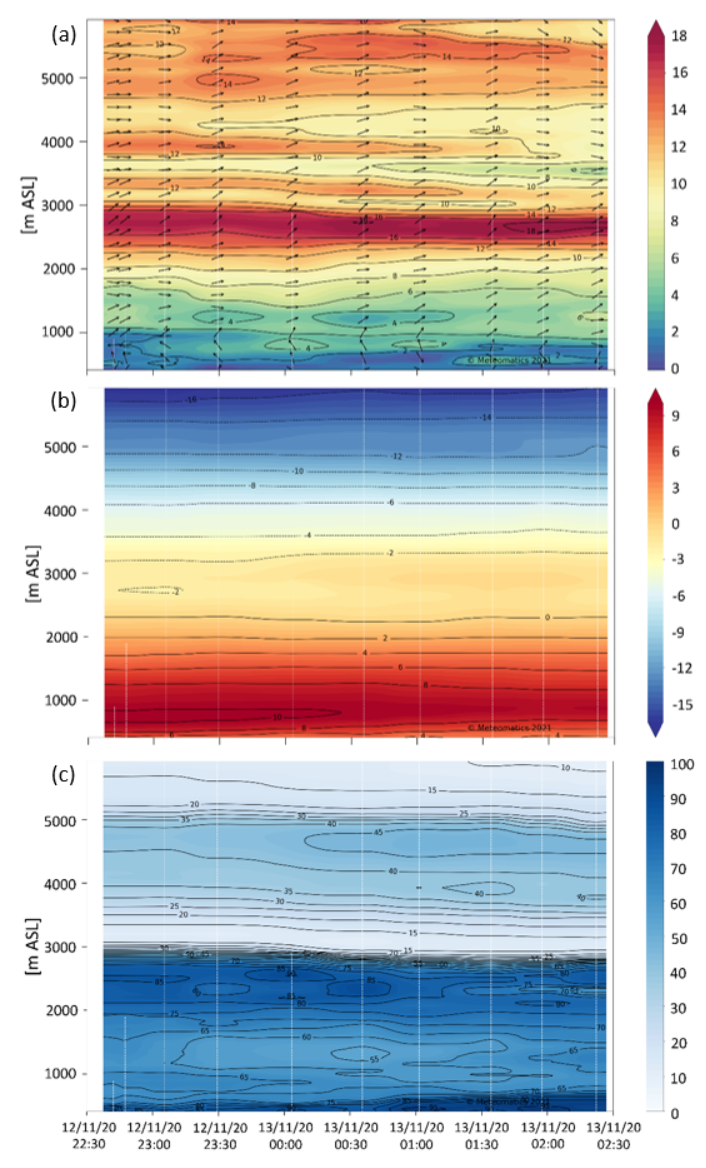
|
Testbeds Several studies have been conducted to assess the potential impact of WxUAS observations on operational meteorology through both data assimilation studies and through supporting operational weather forecasters. An example of using WxUAS observations to improve the prediction of convection initiation in a relative data void - a high alpine desert in Colorado - is shown in Figure 2. WxUAS observations collected during the 2018 LAPSE-RATE field campaign (de Boer et al. 2019) were used to assess their impact on model forecast skill using Observing System Experiments. Details of this study are given in Jensen et al. (2021). The assimilation of WxUAS observations clearly shows the improvement in the depiction of the low-level moisture compared to assimilating observations from a sparse network of surface observations alone. The resulting improved analyses ultimately lead to a much more accurate prediction of the timing and location of convection initiation (Figure 2b). 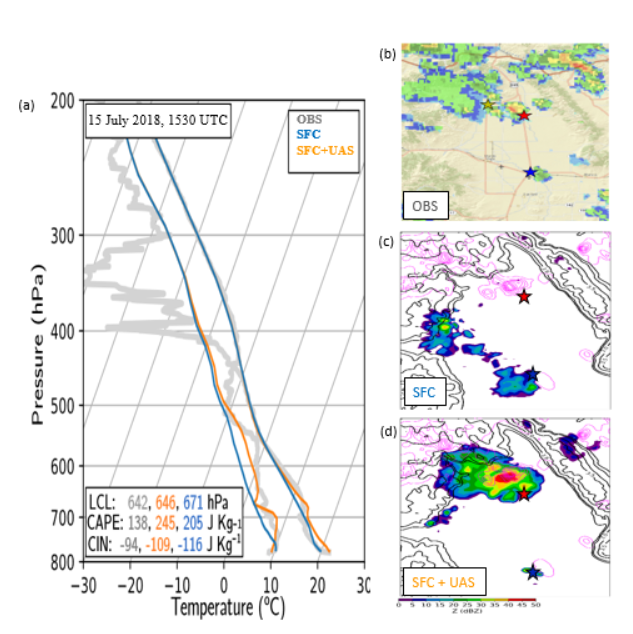
Figure 2. Analyses of temperature and dew point profiles obtained in the center of the San Luis Valley of Colorado using Ensemble Kalman Filter (EnKF) data assimilation with 15-minute cycling of surface observations (SFC) and surface plus WxUAS observations (SFC+UAS) along with independent observed values obtained with a radiosonde (OBS). Column on right shows (b) observed composite reflectivity and that obtained with a 30 min forecast with (c) SFC DA and (d) SFC+UAS DA valid at 2000 UTC. Magenta contours in (c) and (d) denote 3 hour accumulations estimated from the observed composite reflectivity. Red and blue stars denote locations of Moffat and Alamosa, respectively. |
Evidence for improving the support services provided by local weather forecast offices has also been demonstrated through testbed experiments. The first of these was conducted in the summer of 2016 in a project called Environmental Profiling and Initiation of Convection (EPIC) during which WxUAS collected targeted observations in areas where the development of convective storms was anticipated (Koch et al. 2018). This study provided a first glimpse of how WxUAS could be used by operational weather forecasters. More recently the NOAA Air Resources Laboratory (ARL) Atmospheric Turbulence and Diffusion Division (ATDD) in Oak Ridge, Tennessee is conducting a testbed to assess the benefit of routine WxUAS operations. In this testbed, meteorologists at a local weather forecast office are being supplied observations from routine WxUAS flights in realtime to aid in developing their local short term forecasts. ATDD is also working with forecasters to use this new observational data stream to develop new targeted services. An example of this is the utilization of WxUAS observation within a turbulence and diffusion model to predict the health impacts of hazardous chemical releases or smoke from wildfires. The continued development and implementation of new WxUAS technologies through testbed demonstrations will be critical for understanding strengths and weaknesses of this new observing system across a range of environments and for setting up the infrastructure to effectively utilize these new observations. Several demonstration testbeds are planned in the coming year. For example, a 6-month long testbed focused on assessing the performance and reliability of WxUAS in strong winds and icing conditions will commence in Switzerland in November 2021. This testbed will include comparisons of WxUAS observations with radiosonde observations as well as NWP impacts studies. Another set of demonstration testbeds are planned across the U.S. starting in the summer of 2021 including one funded by NASA called Weather Intelligent Navigation Data and Models for Aviation Planning (WINDMAP) which aims to use WxUAS observations to develop improved weather guidance for integration into UAS Traffic Management (UTM) systems across a range of environments. The World Meteorological Organization (WMO) is in the process of developing plans for a year-long WxUAS assessment period during which WxUAS capabilities will be demonstrated across a wide range of environments at locations around the world (with particular emphasis in data sparse locations). The WMO will coordinate efforts to assess the utility and efficacy of WxUAS to routinely and operationally contribute to the WIGOS Global Basic Observing Network (GBON) in support of WMO forecasting applications. A draft white paper on this planned WxUAS demonstration will be made available for comment by mid-summer of 2021 with a targeted period of the demonstration beginning 1 January 2023. pinto |
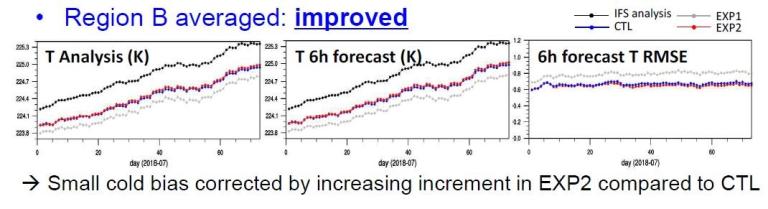
Summary of Recent WMO Data Impact WorkshopThe 7th Workshop on the Impact of Various Observing Systems on Numerical Weather Prediction (NWP) was held virtually 30 November – 3 December, 2020. Several presentations featured the impact of various types of Aircraft Based Observations. These are briefly summarized here. All figures and graphics are provided courtesy of the workshop presentations. Impacts of aircraft and radiosonde descent data on global model at the KMA The investigators performed a series of data denial and sensitivity experiments using the global Korean Integrated Model. For aircraft data, the experiments consisted of a control with data at12 levels in the vertical (CTL), one experiment with no aircraft data (EXP1), and a second experiment (EXP2) with data density increased in the vertical to 21 levels. The two experiments found improvements to the analysis (IFS analysis) of wind and temperature in the mid-latitude upper troposphere, with pronounced improvements to the tropical upper troposphere in the high-density experiment, and especially with a substantially reduced cold bias in the upper tropical troposphere temperature. The improvements were further realized in the 6-hour forecast. |
|
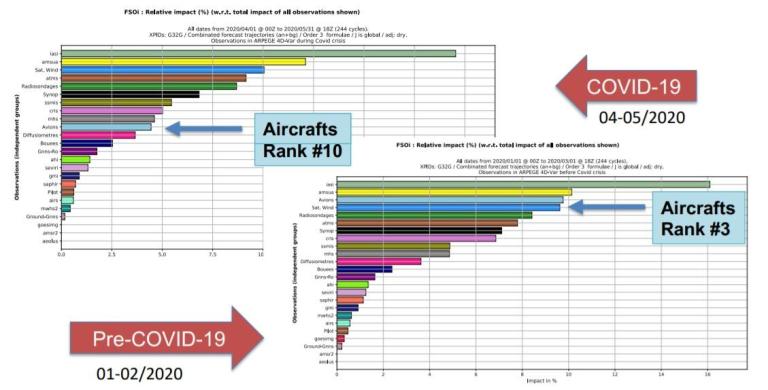
Recent Global Observing System Impact Studies at Météo France The investigators conducted a range of experiments with various observing systems using various tools, including DFS, FSOI, and OSEs. Of note for Aircraft Based Observations (ABO), the investigators, using a series of FSOI experiments during the period April – May 2020 found that ABO fell from having the 3rd greatest to the 10th greatest percent relative impact on forecast skill in the global ARPEGE model. These are striking results in contrast to some other studies showing both the impact of COVID-19 in NWP skill and the importance of ABO overall to the suite of observations impacting NWP skill. |
|
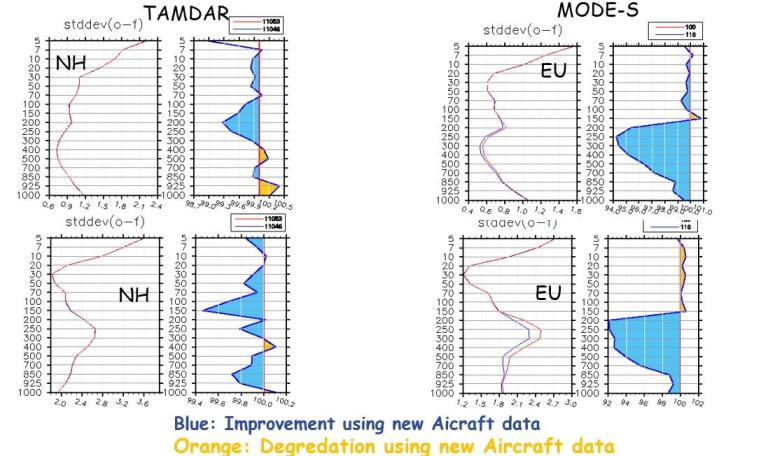
Global impact studies at the Deutscher Wetterdienst (DWD) The investigators conducted data denial and other types of experiments to quantify the impact of many types of observing systems on NWP skill in the German global system. Of interest to the ABO community, one experiment assessed the impact of added TAMDAR observations globally and a separate one from MODE-S over Europe. For most vertical levels the impacts were positive for both data sources, over the northern hemisphere and over the EU. |
|
Impact of aircraft-derived observations (MODE-S) in a mesoscale model The investigators conducted a series of data denial experiments using case studies over Europe with three regional modeling configurations: Here, MRAR= Mode-S Meteorological Routine Air Report Wind, temperature, like AMDAR; and EHS= Enhanced Surveillance. |
These case studies included a winter and summer period in 2013 and 2014; a cold frontal passage on July 24, 2013; forecasts from 0-24 hours for the period 10 January – 10 February, 2011; a thunderstorm/convergence line on 28 May 2013; and data denial experiments in August 2020. General findings included Positive impact +12 h in wind and temperature, virtually in the entire upper troposphere, with particularly encouraging 4DVAR encouraging results. |
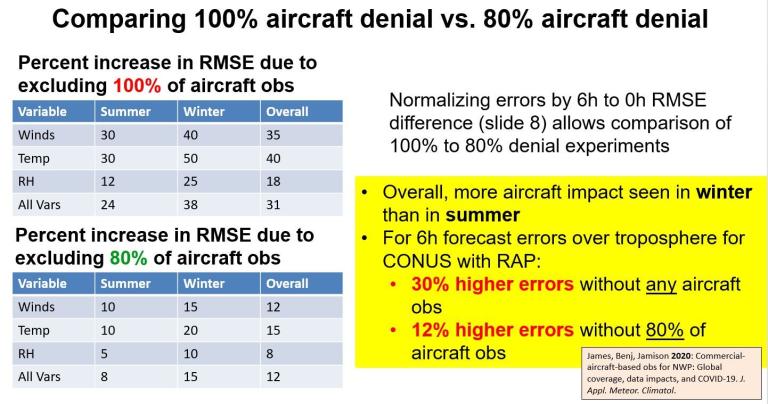
Overview of Recent Observation System Experiments (OSEs) with the NOAA Regional Rapid Refresh Model The investigators provide a comprehensive overview of many recent studies of impact of ABOs with a focus on the USA RAP and HRRR data assimilation and regional modeling systems. Of note, they provide a study showing potential impacts of data loss because of COVID-19 via a series of experiments that quantify the impact a drawn down of 80% and 100% of available data on 6h forecasts for winds, temperature, RH, and all variables, for winter and summer. The following table summarizes their results: |
|
Their summary of conclusions for this and other studies reviewed demonstrate that Aircraft obs remain the most important obs type for rapidly-updating regional NWP models. (2020 papers update from 2017 paper), with broad positive impacts from many other observation types, including: surface and satellite cloud observations on cloud ceiling and surface visibility forecasts, through their use in the stratiform cloud hydrometeor analysis; and satellite radiance observations through channel selection and addressing data latency concerns (20 min data cut-off for US RAP/HRRR runs). For COVID-19, realtime NWP impacts are challenging to detect, but controlled experiments reveal statistically significant increased 6-12h forecast error over US in RAP model from reduced aircraft reports. Averaged across summer and winter seasons, and across tropospheric temperature, winds, and RH, excluding 80% of aircraft obs leads to a 12% forecast degradation, compared with 30% degradation when all aircraft obs are denied. |
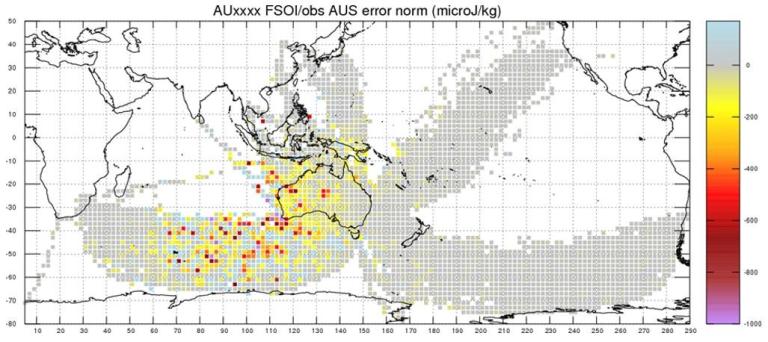
ACCESS Forecast Sensitivity to Observations and Observing Network Assessments The study examined the impact of a variety of observing systems using FSOI in the Bureau operational NWP system ("ACCESS"). Of particular interest to the Global AMDAR community, on part of the study examined the impact of a nearly one-year (Sept 11 2018 - Aug 1 2019) feed of AMDAR data from Air Nuigini. The following figure illustrates the impact in normalized energy units: |
|
| Per the author, “FSO impacts aggregated into 2x2 degree boxes to produce a spatial map of impact/observation for the same period in which the Bureau received the Air Nuigini data. Yellow > red > purple represent beneficial (negative) impacts; grey is neutral (zero) impact. No surprises: flights "upstream" (in the weather sense) of the Australian region have the most impact, and, as we might expect, flights over the eastern states, and over most of the Pacific, are neutral.” |
NWP-based evaluation of radiosonde network and AMDAR data in China This study examined key three research questions for China: Methodology focused on sensitivity of areas and layers of upper-air observation using OSSE+FSOI, and an OSE study for the possibility of AMDAR data replacing sounding in some areas or some time. Key conclusions are:
|
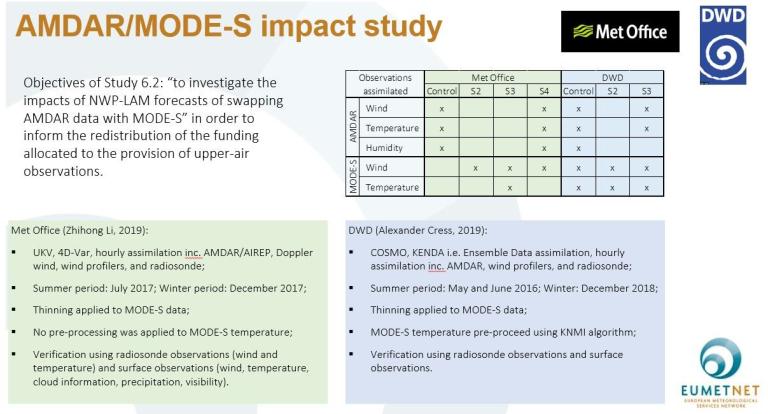
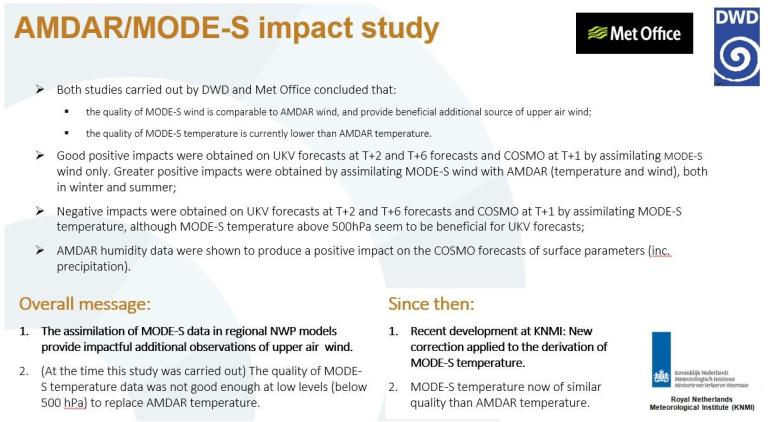
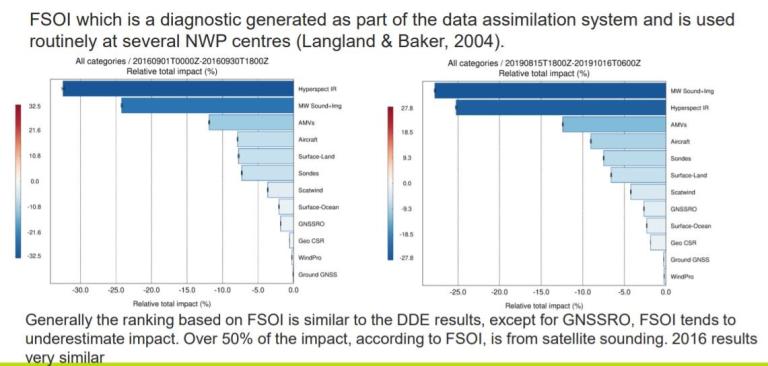
Observation Impact Study Requirement for EUCOS Region (Dr Jacqueline Sugier, EUCOS Science & Project Manager, EUMETNET) For ABO in particular, this presentation offered the following summary for the requirement 6.2 for the EUCOS region: |
|
|
A review of Observation Impacts through Data Denials and FSOI metrics at the Met Office This study revisited the impact of all the main observation categories through a series of dedicated Data Denial Experiments (DDEs) and ranked the categories in terms of mean scorecard results, and provided an indication of relative impacts from the FSOI metric. The revisit is relative to 2016 results and meant to capture changes that have occurred since that time in the configuration of the overall observing system and Met Office data assimilation and modeling. DDEs were DDEs were run over three-month period: 15th August 2019-15th November 2019. The following figure summarizes the FSOI results: |
The main conclusions of the authors with respect to ABO is that they continue to be an important source of observational data, ranking fourth-most important in this analysis. |
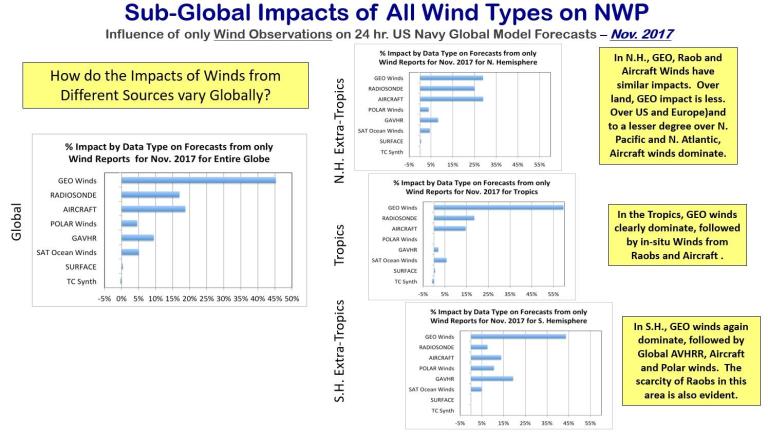
Assessing the Impact of Atmospheric Wind Observations from Satellites and Aircraft at Global and Regional Scales This talk focused on the relative impact of Satellite and Aircraft Wind Observation on Analyses and Short-range Forecasts from the US Navy Global Model and included:
One particularly interesting aspect of this study for the Global AMDAR community is its finding that the addition of AMDAR data over South America after November 2016 greatly increased their impact on NWP in that region with a noted impact globally. In fact, over South America, they became the most important source of in-situ data, above radiosondes and surface data. The following figure illustrates that in the tropics and both in the Northern and Southern Hemisphere subtropics, AMDAR and now consistently the third-most important source of observational data: |
|
Moreover, the authors conclude AMDAR Temperature and Wind data are among 4-5 most important data sources for global assimilation across multiple NWP centers and endorse their continued support because they are:
|
Monitoring and Assimilation Impact Study of ABO FLYHT Data at the Canadian Meteorological CentreIntroductionThe stabilization and potential expansion of the Canadian AMDAR program is being investigated through a contract with FLYHT Aerospace Ltd. for the provision of AMDAR data from First Air and Canadian North airlines. Approximately 50,000 observations from 11 Boeing 737 aircraft are received monthly. These observations are located mainly over the western sections of Canada and the province of Quebec (Figure 1). Most of the reports are below 400hPa during ascent and descent phases of flight which provide many temperature and wind profiles daily in data-sparse areas. 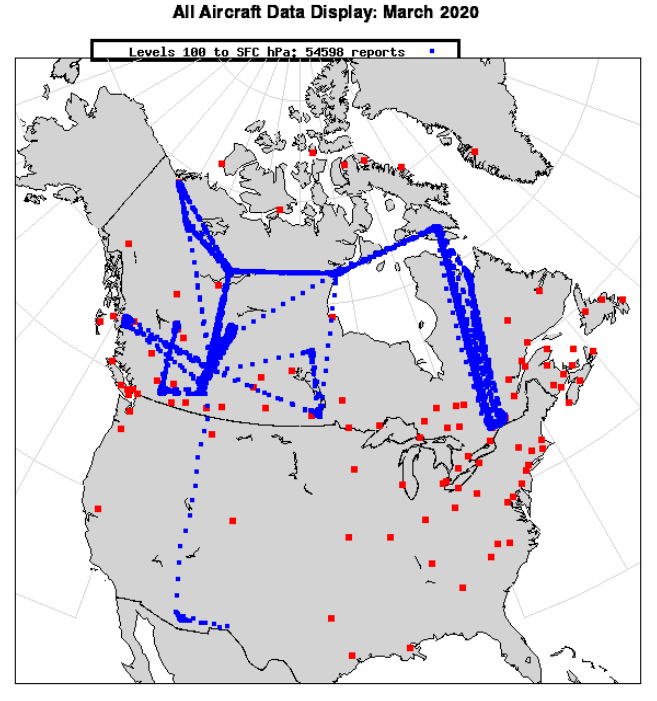
Figure 1: Geographical coverage of FLYHT aircraft-based observations decoded by Environment and Climate Change Canada (ECCC) during March 2020.This study examines the impact of the FLYHT AMDAR reports into the Canadian Regional Deterministic Prediction System (RDPS). The RDPS is a forecast system based on a limited-area (LAM) configuration of the Global Environmental Multiscale (GEM) model with a 10km horizontal grid spacing covering North America. Except for one aircraft, the comparison of these observations and short-range forecasts produced shows that their quality is as good as the other AMDAR reports operationally assimilated in the RDPS. From these encouraging results, a set of Observing System Experiments (OSEs) were carried out for the mostly pre-COVID 19 winter period of February and March 2020 to measure the impact of these reports on 48-hr forecasts. Observing System Experiment with the RDPSDuring the February through March 2020 period, a series of 48-hr forecasts were made at 12-hr intervals (00UTC and 12UTC [120 cases]). The operational RDPS was used as the control for the evaluation period. The experiment consisted of adding the FLYHT data to the operational observations being assimilated. Three aircraft having suspect temperature values were blacklisted and not used in this OSE. The analyses and forecasts from the control and FLYHT aircraft-based observation (ABO) experiments were compared against the operational upper-air and surface quality-controlled data to evaluate their performance. Because of the limited impact expected with the FLYHT reports, only statistically significant results were considered. Figure 2 presents a summary of the averaged relative change in root-mean-square error (RMSE) calculated for the 48-hr forecasts and for all variables together over different domains. The relative change in RMSE defines the improvement where positive (red) values represent improved forecasts with respect to the control experiment. The forecasts are evaluated against wind and temperature observations from aircraft and radiosondes as well as wind, temperature and surface pressure observations from surface stations (SYNOP). The FLYHT ABO experiment generally improves the upper-air forecasts in northern Canada (+0.65%) and southwest Canada (+0.47%). Over North America (full domain), the improvement index is +0.17%. |
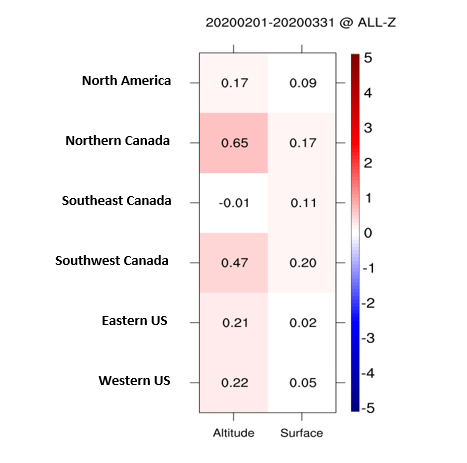
Figure 2: Summary of the averaged relative change (%) in RMSE for the 48-hr forecasts over (from top to bottom) North America (full domain), northern Canada, southeast Canada, southwest Canada, eastern US and western US against upper air and surface observations. |
| An assessment of the results at the 48-hr forecast lead time for individual variables at different vertical levels also was conducted (figure 3) against operational aircraft wind and temperature observations over North America for the 120 cases. Improvements of the RMSE score are statistically significant for winds at a few vertical levels. No statistically significant improvements were noticed for temperature. |
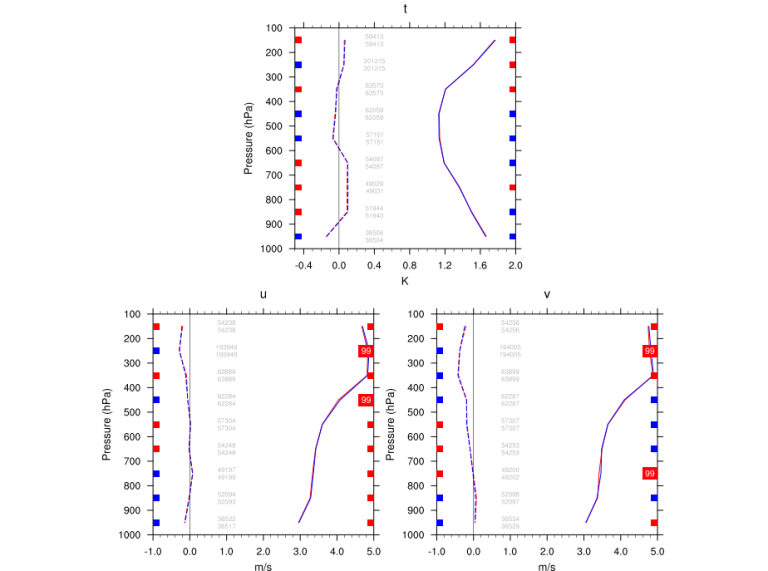
Figure 3: Vertical profiles of 48-hr forecast verification scores for the control (blue) and the FLYHT ABO (red) experiments against aircraft over North America. The bias (dashed curves) and RMSE (solid curves) are shown for temperature (TT; top panel), zonal wind (UU; lower left panel) and meridional wind (VV; lower right panel). Scores are averaged over 120 cases. Colored boxes on the left (right) of each panel indicate the level of statistical significance for bias (RMSE) and superimposed numerical values indicate statistical significance above 90%. Red (blue) boxes indicate that the FLYHT ABO experiment performs better.Other improvements in RMSE are noted for wind forecasts for most vertical levels and most lead times up to 48 hours (not shown). Gains in temperature performance are limited to the 42-hr forecast lead time. Thus, the experiment with additional FLYHT ABO provides some small but statistically significant upper-air forecast improvements over the control experiment. ConclusionsThis study has clearly demonstrated the importance of the First Air and Canadian North aircraft observations provided by FLYHT in the ECCC regional forecast system especially over southwest and northern Canada where most of the observations are located. The geographical coverage offered by these airlines fills in part an important data gap in Canada as demand is growing for more detailed and relevant information on real-time observations. Furthermore, the data’s impact, although small owing to the limited number of observations over Canada (11 aircraft), overall is positive. ABO are expected to continue to be important as more observations from these and other national airlines servicing additional airports in northern Canada and the Arctic expand and grow. yulia [dot] zaitseva |
Chicago CWSU Severe Icing Impact-Based Decision Support Service (IDSS)Severe low-level icing impacted operations at O’Hare International Airport (ORD) on Monday, November 30, 2020. Collaboration efforts between Center Weather Service Unit Chicago (CWSU ZAU), Weather Forecast Office (WFO) Chicago and the Aviation Weather Center (AWC) were continuous throughout the day and aided the FAA in circumventing the icing event's risks. Ultimately, a safe and continuous flow of traffic into ORD was maintained through the use of two icing avoidance procedures. ORD Operations: West Flow, where aircraft depart and land towards the west, was favored due to a prevailing north-northwesterly wind. Tailwinds below 10kt allowed for either West or East Flow and ORD intended to stay in a West Flow configuration based on forecast winds. Departures climbed quickly after takeoff reaching ten thousand feet or more above the surface within the first several minutes of flight. Meanwhile, due to airspace restrictions and the safe flow of air traffic in ZAU and the Chicago Terminal Radar Approach Control Facility (TRACON) (C90), arrivals experienced a gradual descent towards the runways, generally traversing the lowest mile of the atmosphere for an extended period of time. 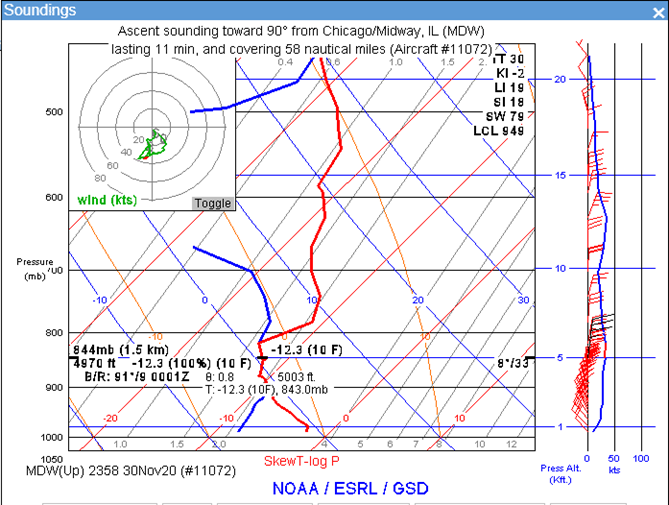
Meteorology: The relatively deeper -8° to -13.5°C lake effect clouds over and adjacent to Lake Michigan (as shown in the AMDAR sounding from nearby Chicago Midway Airport) meant that aircraft arriving on West Flow would be in the layer of supercooled cloud droplets for as long as 10 to 15 minutes. While icing conditions are often most problematic in areas of large supercooled drops with temperatures warmer than -15°C, as was the case here, such a long duration in this layer also proved to be conducive to severe icing. IDSS and its impacts: ORD began operations on West Flow and numerous moderate and one severe icing pilot reports (PIREPs) were received during the 12Z arrival push. The CWSU meteorologist issued a Center Weather Advisory for moderate to isolated severe icing and later collaborated a severe icing SIGMET with AWC when he recognized that the pattern would persist throughout the day. The FAA reacted by switching to East Flow at ORD, referred to colloquially as “turning the airport around.“ Departures then were able to climb quickly through the deeper cloud layer while arrivals traversed the thinner layer of clouds to the west of the airport. Later that afternoon winds backed more northwesterly and remained gusty, forcing C90 to turn ORD around again back to West Flow. Multiple pilots reported severe icing conditions causing other pilots to refuse to fly through the reported hazardous conditions and aircraft were put into a holding configuration. Many of these severe icing reports were heard by the CWSU meteorologist on LiveATC as much as 10 to 15 minutes before they were available in the traditional reporting systems. C90 mitigated the icing risk through the remainder of ORD's busy arrival hours by holding aircraft just above the cloud layer and then descending them quickly onto their final approach to the airport. Moderate icing reports continued thereafter, but no additional severe icing reports were received. Significant impacts also were felt by airport operations on the ground including United Airlines (UAL). Because air temperatures at the surface dropped below freezing, ice on the arriving aircraft did not melt and required de-icing before those planes were able to depart on subsequent flight segments. According to Mike Fox (UAL Managing Director Station Operations Center - ORD), the severity of the icing required as much as two to four times the typical de-icing fluid required for inbound aircraft. The image shows significant buildup of mixed ice (both rime and clear ice) on the windshield of a UAL plane, while surface conditions were dry. |
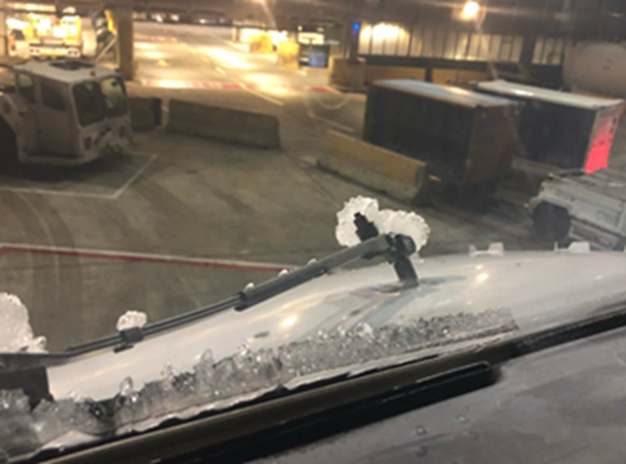
Photo courtesy of Mike Fox (UAL).Collaboration between the Chicago Center CWSU, the AWC and WFO Chicago was crucial in helping the FAA and airspace users mitigate the risks associated with en route icing conditions. andrew [dot] p [dot] snyder |
Feature Article - Comparing the Quality and Consistency of AMDAR and TAMDAR Meteorological ObservationsSynopsis Thousands of meteorological reports are taken daily by commercial aircraft providing atmospheric profiles with greater temporal density and at more locations than the operational radiosonde network. These reports are available through two largely complementary systems, the freely available Airborne Meteorological DAta Relay (AMDAR) and the commercially available Tropospheric Airborne Meteorological DAta Reporting (TAMDAR). Both systems provide temperature and wind reports, but TAMDAR aircraft also measure relative humidity while a subset of AMDAR aircraft equipped with the Water Vapor Sensing System (WVSS) measure specific humidity. Using a year-long set of Aircraft-minus-Radiosonde (AmR) comparisons, it was documented that AMDAR observations largely outperform TAMDAR reports for all parameters. A more thorough discussion is available at the University of Wisconsin library here (and hereafter referred to as W&P.) Procedures The first long-term joint assessment of AMDAR to TAMDAR against collocated radiosondes in common environments was compiled over the entire calendar year 2018. Aircraft-based Observations (ABO) were matched to high-resolution radiosonde reports using vertical, horizontal and temporal limits of 10 hPa, 50 km and 30 min. These data were corrected for aircraft movement and radiosonde drift. Only radiosonde values that met these matchup criteria for at least one AMDAR and one TAMDAR report were included. To assure that each ABO provided similar reporting frequency, results only were used from the earth’s surface to 400 hPa and aggregated over 50 hPa deep layers. Although automated quality procedures already had been applied to the data sets, some outliers remained, especially in the TAMDAR records [e.g., three standard deviations (σ) for raw TAMDAR temperatures exceeded ±16°K vs. ±3°K for AMDAR]. An additional quality control measure that rejected ABO reports which differed from radiosondes by more than 3σ affected the accepted AMDAR range only slightly (<±2.4°K) but decreased the TAMDAR range substantially (<±6.6°K). Had the stricter AMDAR-based 3σ limits been applied to both data sets, the rejection rate for TAMDAR temperatures would have increased from approximately ~ 2% to nearly 10%. Results a. Winds: AmR differences for the two ABO systems were calculated for wind speed (a) and direction (b) individually and combined as the vector difference (c). For all parameters, AMDAR wind observations outperform TAMDAR reports collected from smaller aircraft by nearly a factor of two (see inserts in Fig. 1). Systematic speed differences (averages) are of opposite signs (-0.4 m s-1 for AMDAR vs. +0.75 m s-1 for TAMDAR) while directions show differences of +1.5° and +4.9° respectively. Random differences (σ) are larger for both systems, but with AMDAR being nearly twice as consistent as TAMDAR [±1.77 m s-1 (±23.0°) and ±3.46 m s-1 (±39.7°) respectively]. Root Mean Squared (RMS) Vector Differences (RMSD), which combines both speed and directions differences, indicate TAMDAR disparities nearly double those from AMDAR (3.97 m s-1 vs. 2.21 m s-1). |
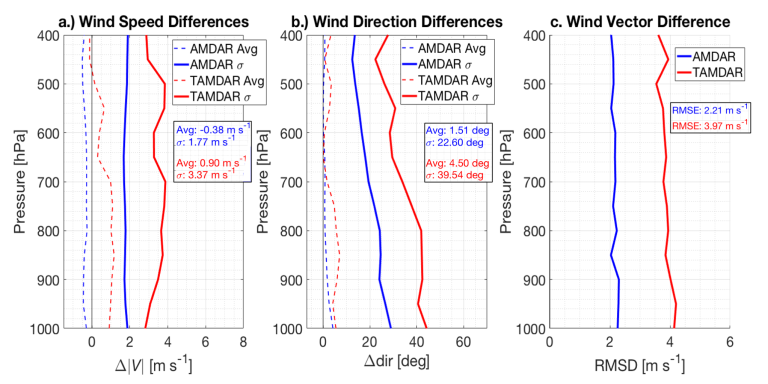
Figure 1: a.) Vertical profiles of the AmR difference averages (dashed) and standard deviations (solid) wind speed in (m s-1) for AMDAR (blue) and TAMDAR (red). b.) As in a., but for wind direction in degrees. c.) As in a., but for the RMS of the vector difference (RMSD). Inset statistics represent aggregated values from surface to 400 hPa. |
Viewed vertically, TAMDAR wind speed differences and standard deviations from radiosondes appear relatively constant with height but are noticeably larger and less consistent than those from AMDAR. AMDAR average direction differences are consistently small, while TAMDAR switches from positive near the surface to negative above 750 hPa. Random differences for both systems decrease with height, but with AMDAR maintaining a substantial advantage. AMDAR wind vector RMSDs remain nearly constant vertically (~2.2 m s-1) while TAMDAR values decrease slightly with height, remaining near ±4.0 m s-1. (More details in Section 3a of W&P.) b. Temperature: Overall, AMDAR temperature observations are systematically cooler than and in much better agreement with radiosondes (average difference and standard deviation of -0.20°K and ±0.80°K) than the warmer TAMDAR reports (+0.25°K and ±2.19°K). |
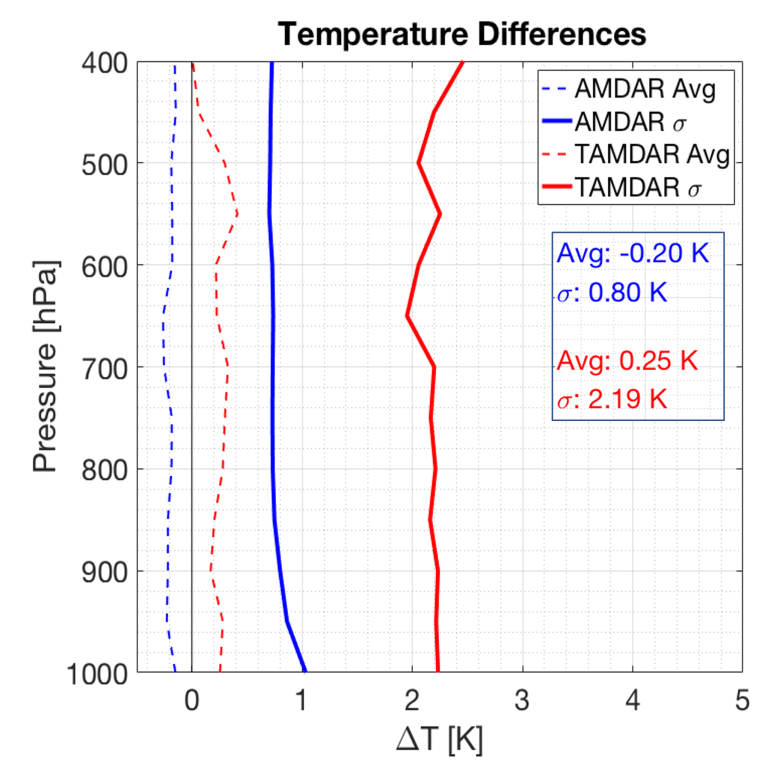
Figure 2: Same as Figure 1, but for temperature |
Vertical profiles (Fig. 2) show fairly uniform average AmR temperature differences. Random differences decrease from ~±1.0°K in the lowest levels to ±0.7°K above about 850 hPa which are consistent with small-scale variabilities expected between radiosonde sites and nearby airports. By contrast, average TAMDAR differences increase from 0.3°K near the surface to 0.4°K at 500 hPa, with standard deviations increasing irregularly from ±2.1°K near the surface to ±2.7°K aloft, more than double the AMDAR uncertainty. (More details in Section 3b of W&P.) c. Humidity: Because humidity parameter conversions require contemporaneous temperature observations, direct comparisons of the two different humidity measurements [Specific Humidity (SH) from AMDAR/WVSS and Relative Humidity (RH) from TAMDAR] are challenging. Using temperatures that contain large biases and uncertainties can skew and exaggerate intercomparison results, obfuscating the quality of the ABO humidity reports. As such, three different AmR intercomparisons were calculated for each ABO system. The first uses only direct aircraft observations of both temperature and moisture in humidity parameter conversions and provides a measure of observations made solely by aircraft. In an attempt to assess the quality of the ABO humidity sensors themselves (without the additional effects of temperature errors), a second set of intercomparisons used collocated radiosonde temperatures to derive SH and RH values. Finally, done in an attempt both to increase the accuracy of other aircraft observations made away from radiosonde sites and also to provide an estimate of the efficacy of ABO moisture data used by forecasters in real time, a third set of tests used bias-corrected aircraft temperatures. 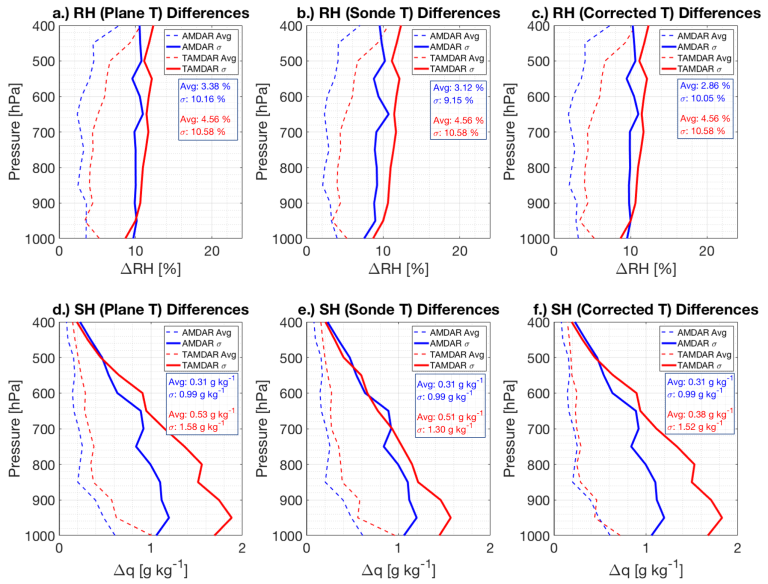
Figure 3: a.) Vertical profiles of the AmR average difference (solid lines) and standard deviation (dashed lines) for AMDAR (blue) and TAMDAR (red) RH observations in percent in pressure coordinates. AMDAR/WVSS SH reports are converted to RH using the aircraft temperatures. b.) As in a., but with AMDAR/WVSS data converted to RH using the collocated radiosonde temperatures. c.) As in a., but using bias-corrected AMDAR temperatures. d.) As in a., but for SH. TAMDAR RH reports converted to SH using the aircraft temperatures. e.) As in d., but for TAMDAR RH converted to SH using the collocated radiosonde temperature. f.) As in d., but using bias-corrected TAMDAR temperatures. |
AMDAR/WVSS almost always outperformed TAMDAR at all levels for both SH and RH independent of which parameter conversion temperatures are used. Both sensors tend to produce observations that are moister than the radiosondes. Aircraft-only AMDAR RH comparisons in Fig. 3a show systematic and random differences that are slightly lower than the directly measured TAMDAR reports (averages and standard deviations of +3.38% and ±10.16% vs. +4.56% and ±10.58% respectively). Removing all temperature difference effects in AMDAR humidity conversion optimized AMDAR comparison to +3.12% and ±9.15% respectively. For SH (Figs. 3d and 3e), the directly-observed WVSS differences were 30-50% smaller than derived TAMDAR regardless of which temperature was used to convert RH to SH [+0.31 g kg-1 and ±0.99 g kg-1 for AMDAR vs. TAMDAR values of +0.53 g kg-1 and ±1.58 g kg-1 (with ABO temperature) and +0.51 g kg-1 and 1.30 g kg-1 (optimal, using sonde temperature)]. Using bias corrected temperatures in the humidity calculations (Figs. 3c and 3f) showed some improvement in systematic differences between the ABO and radiosonde relative to the uncorrected results in panels a and d. Random differences, however, remained high especially for TAMDAR. It is recommended that, at a minimum, all ABO temperature observations be subjected to bias removal procedures before any moisture parameter conversions are attempted in operations. Further tests suggested that moister aircraft observations were not likely the result of known dry biases in validating radiosonde observations. (More details in Section 3c of W&P.) d. Aircraft to Aircraft Observations: With the high density of flights in and out of major airports, direct comparisons between aircraft data also were conducted to assess the repeatability of the ABO observations. To assure that the results represented the same atmospheric conditions, the matching criteria were expanded to require that two AMDAR and two TAMDAR reports were needed to match each radiosonde data point. AMDAR provided more consistent observations between aircraft than TAMDAR across all observing categories. Humidity observations made directly by both AMDAR and TAMDAR showed better agreement in more aircraft-to-aircraft comparisons than in aircraft-to-radiosonde observations. In the moister environments between 750 hPa and the surface, aircraft-to-aircraft RMS for AMDAR SH remained similar to aircraft-to-radiosonde values (increasing from ±1.07 g kg-1 for the full troposphere to ±1.28 g kg-1 for regions below 750 hPa), considerably smaller than the derived TAMDAR SH (±1.91 g kg-1and ±2.14 g kg-1). (More details in Section 4 of W&P.) Summary and Conclusions Two largely complementary ABO systems currently are operating within CONUS. An open question is whether one of these systems performs better than the other over a wide variety of atmospheric conditions. In this study, AMDAR and TAMDAR observations were compared against full resolution NWS radiosonde observations over the CONUS for all of 2018. In order to remove obvious outliers that had passed internal system quality control checks, a gross error check was needed beyond that used by the data providers. As this study illustrates, the accuracy and repeatability of AMDAR/WVSS as compared to TAMDAR along with the benefit of a worldwide network to acquire and disseminate them, it is clear that the global operational meteorological community would be well served to expand the reach of AMDAR and WVSS observations. As noted by WMO (2017) and IATA (2020), national meteorological and transportation services would do well to join with air carriers in their regions to explore mutually beneficial partnerships that would increase the number of airborne observations (especially from WVSS) in otherwise under-observed regions such as much of the Southern Hemisphere. ralph [dot] petersen |
Contacts | |
WMO INFCOM, Joint Expert Team on Aircraft-Based Observing Systems Contacts Chair Vice-chairs nrivaben | WMO AMDAR Observing System Newsletter Editor ceweiss1949 WMO Aircraft-based Observations dlockett mhuuskonen |