WMO ABO Newsletter - Volume 23, April 2022
Welcome from the Chair of the JET-ABOOn behalf of the JET-ABO co-chairs and the WMO Secretariat, welcome to the April 2022 edition of the WMO Aircraft-Based Observations Newsletter. With good science and good fortune, we can hope that the globe will continue to recover from the COVID-19 pandemic and you in the ABO community continue to be safe and healthy. I would like to thank Carmen Emmel of Deutsche Wetterdienst for agreeing to take on the role of Co-Vice-Chair with Nicolas Rivaben. Carmen steps into the role following the departure of Stewart Taylor of the UK Met Office as he transitions into partial retirement. We thank Stewart for his many years of service to the JET-ABO and earlier bodies and for his many and substantial contributions to the global ABO Programme and wish him the best in his new chapter in life. In this edition of the newsletter, we provide updates on the status of regional programmes, the WVM programme and a series of articles featuring contemporary topics. These include an update on the status of the UAS Demonstration Campaign, WICAP and highlights of the utility of AMDAR in recent research and operational events. Also included and very importantly, there are two more technical articles on the use of aircraft-based observations in meteorological applications. As we emerge from COVID-19, we are pleased to report we will begin to transition to more in-person engagement. Our second JET-ABO Session for 2022 will feature a hybrid format with the Leadership Group present in Geneva. In September, the JET-ABO will host a hybrid format workshop on aircraft derived data, again in Geneva. Further details are provided below. In the months ahead we hope to begin planning for further in-person engagements such as our regional workshops and technical meetings. As we all know, Zoom is great technology, but it presents its challenges with attendees all over the globe, and it is nice to see each other every now and then, in person! Lastly, we thank the authors of the contributions below for their time and effort and all involved in assembling this Newsletter, in particular, our voluntary, hard-working Editor, Carl Weiss. curtis [dot] marshall |
Status of Aircraft-Based ObservationsThe graphic below shows the smoothed monthly average of daily aircraft-based observations (single point measurements in space and time, mainly of air temperature and wind speed and direction, made by an aircraft) transmitted on the World Meteorological Organization (WMO) Global Telecommunications System (GTS) since 2007 up to October 2021, as contributed by:
The observations from the WMO AMDAR observing system are the output from 12 operational AMDAR national and regional programmes in cooperation with some 43 national and international participating airlines, as listed on the WMO website. 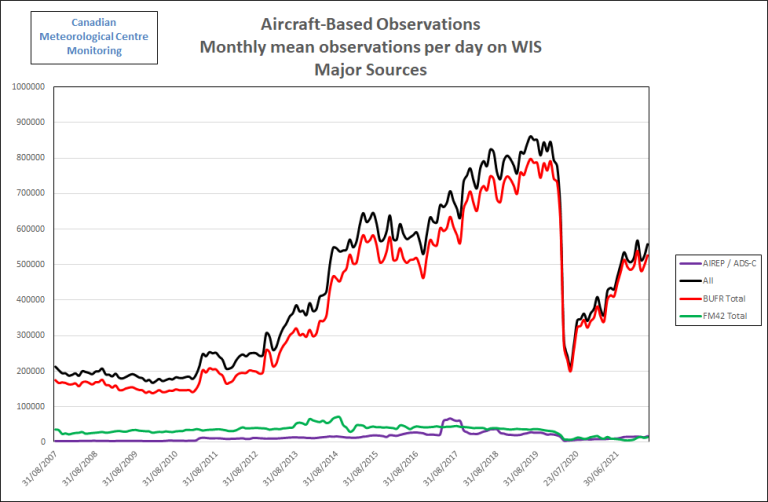
ABO Data Volumes, Coverage and Impact of COVID-19The graph shows that recently towards the end of 2019 and start of 2020, aircraft-based observations data volumes had increased to a historical maximum of more than 850K observations per day on the GTS, with AMDAR observations making up the majority of these at around 750K observations per day. From March 2020, as a direct result of the impact of COVID-19 on the aviation industry and airlines, the volume of aircraft-based observations overall fell to around 245K observations per day and to 230K for AMDAR - around 30% of December data volumes for both. The biggest monthly reduction occurred in May 2020, with only an average of 210K observations per day available. Since then, data levels have gradually increased overall with mean daily total observations at around 558K observations per day in April 2022, which is around 65% of the December 2020 data volume. The graphic below shows ABO data volumes by WMO region since January 2018, where it can be seen that the recovery varies greatly from region to region and on a monthly basis within each region, as countries and regions emerge from the crisis and aviation operations start to increase accordingly. Over the past several months, data levels have steadily climbed over the northern hemisphere regions generally, while the southern hemisphere regions and programs continue to struggle. |
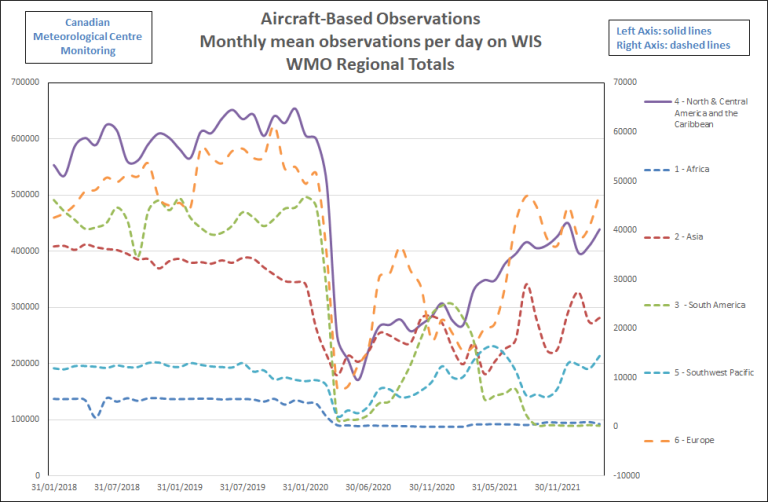
While the aviation industry outlook still remains relatively uncertain, we can expect that the recovery will continue slowly, based on the forecasts from IATA that "overall traveler numbers to reach 4.0 billion in 2024 (counting multi-sector connecting trips as one passenger), exceeding pre-COVID-19 levels (103% of the 2019 total)". Availability of Global FLYHT DataFLYHT is providing AMDAR data coverage over all WMO regional associations as can be seen in the image below which depicts the AFIRS data coverage for the period of April 1 through April 30. During this period FLYHT received AMDAR-over-AFIRS sounding information from 82 aircraft for a total of 13,199 soundings over the month. |
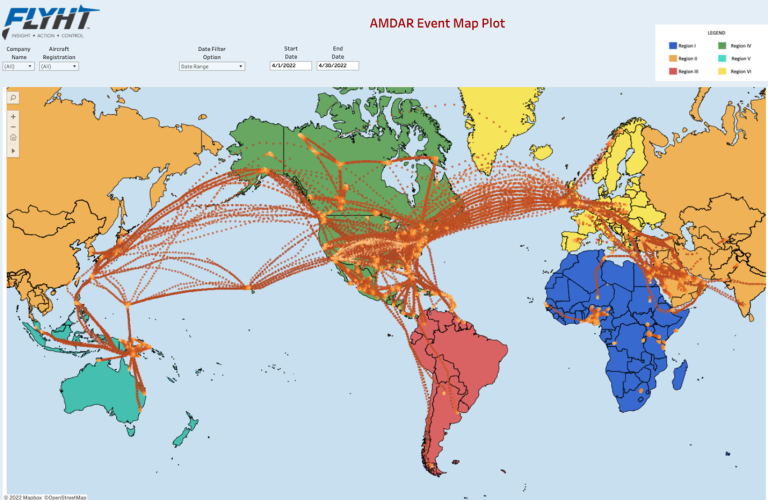
FLYHT is continuing to work with additional airlines to potentially increase data availability over various regions of the world. Thanks to Program PartnersWMO and its Members are grateful to our aviation industry and airline partners for their continued contribution to the WMO Aircraft-based Observing System and the AMDAR Programme. The data that are produced from this collaboration are utilized within many meteorological applications and forecasts, benefiting aviation operations and safety, other application areas and the wider general public. For more information on aircraft-based observations data statistics visit the WMO Community Platform Aircraft-Based Observations site. |
ABOP Water Vapor MeasurementGlobal Water Vapor Measurement Summary and UpdateAircraft Based Observation (ABO) water vapour data are a highly valued input for numerical weather predictions and in general forecast operations. The available ABO water vapour observations from commercial aircraft currently are measured by two distinct sensor systems: the Second-Generation Water Vapor Sensing System (WVSS-II) and Tropospheric Airborne Meteorological DAta Reporting (TAMDAR). WVSS-IICurrently, there are 148 commercial aircraft equipped with WVSS-II sensors worldwide of which 139 belong to RA-IV (North America) and nine to RA-VI (Europe). The number of WVSS-II-equipped aircraft has remained unchanged since 2017. The table below shows the breakdown of WVSS-II reporting aircraft across all WMO Regions. 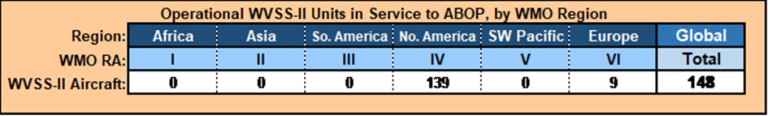
UPS and Southwest Airlines operate the WVSS-II-equipped aircraft in North America and Lufthansa in Europe. |
During the past two years, the number of European WVSS-II observations was impacted severely by the COVID-19 pandemic while data loss was much less over North America. While NOAA/NWS and E-ABO networks provide WVM observations predominantly from their respective regions (RA-IV and RA-VI), all participating airlines routinely travel outside the confines of their home territory enhancing the WVM data available in those data sparse areas. 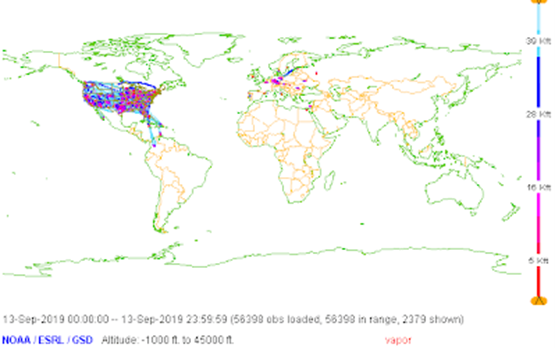
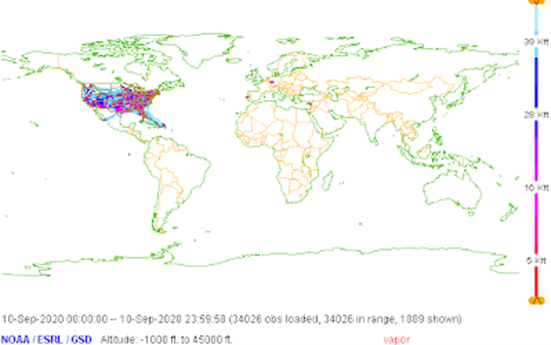
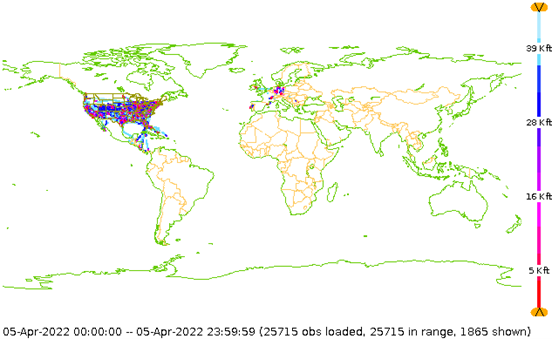
24 hours of Global WVM data from Sept. 2019 (top), Sept. 2020 (middle) and Apr. 2022 (bottom) during the COVID-19 pandemic (Graphic courtesy of NOAA/ESRL/GSD) |
US WVSS-II ProgramDuring the first quarter of 2022, a total of 131 individual aircraft equipped with WVSS-II sensors provided many hundreds of water vapor profile observations within the RA-IV region on a daily basis. The availability of these data had remained generally consistent throughout the COVID-19 pandemic as the participating carriers, Southwest Airlines and the United Parcel Service, were able to maintain service with many of their aircraft. In addition to the contiguous United States, each carrier is able to provide a broader geographic coverage of water vapor observations in RA-IV. Southwest Airlines features aircraft routes to the Caribbean region and to Hawaii while UPS aircraft operate some transoceanic routes. The accompanying graphs depict the daily totals of aircraft, profiles of water vapor data proximal to airport locations and total singular reports of water vapor through the period of 01 January to 31 March 2022. 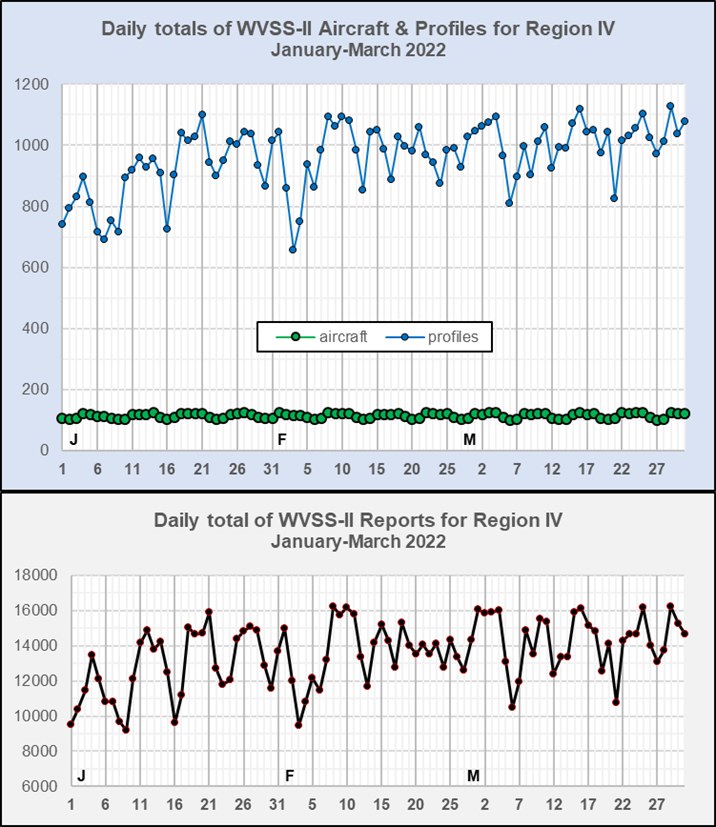
EUMETNET WVSS-II ProgramAfter several full stops of all European WVSS-II flights during 2020 and 2021 due to the COVID-19 pandemic, since the beginning of the pandemic, observation numbers reached their highest values during the last quarter of 2021. Despite the announcement of Lufthansa last fall to halt their WVSS-II flights between November 2021 and April 2022, one to four European WVSS-II aircraft were operating continuously but at a reduced data level. Six of the nine European WVSS-II aircraft are operating again providing up to 35 profiles per day in total. Another two aircraft are anticipated to return to service in April and the last of the nine aircraft is expected to be back in operations by mid July of 2022. The graph below shows the variability in WVSS-II observations since January 2019. |
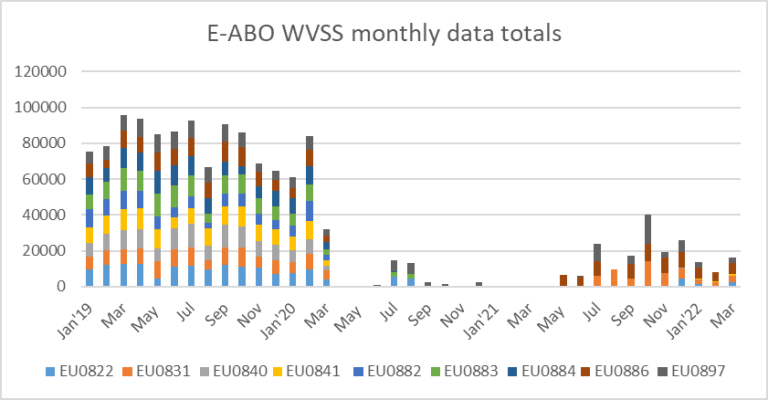
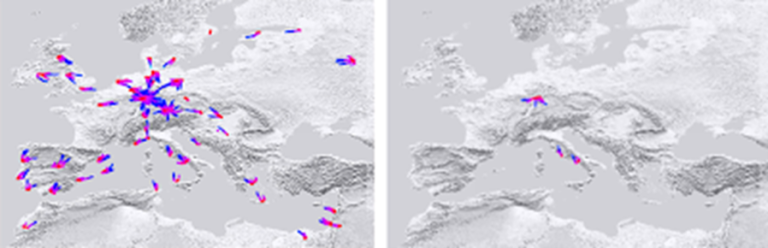
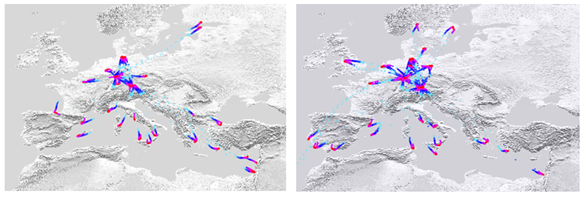
The following figures show the RA-VI coverage of WVSS-II data over a one-week period (30th September - 6th October) for 2019 (top left) and 2020 (top right), (27th September – 3rd October) for 2021 (bottom left) and (28th March – 3rd April) 2022 (bottom right). |
The UK Met Office’s plan to install a number of WVSS-II humidity sensors on UK-based aircraft continues to move forward. Though as yet, no firm commitment to participate has been reached with potential airlines. A single-phase implementation of thirty sensors currently is scheduled to begin in late 2022/early 2023. |
TAMDARFLYHT saw a slight increase in TAMDAR soundings over the fall and winter months as COVID-19 conditions improved and more people traveled during the holidays. In total, 352 aircraft are equipped with TAMDAR sensors worldwide. However, Horizon Air recently announced they will be returning or retiring their Q400 fleet by the end of 2023. FLYHT expects six TAMDAR-equipped aircraft to be moved out of service within the next six months. This will cause a reduction of TAMDAR soundings over the Pacific Northwest. FLYHT expects the TAMDAR numbers for other equipped airlines will remain consistent over the next few months with a potential for growth in the sounding counts as the remaining TAMDAR fleet returns to service. The map below shows the TAMDAR observations for February 2022. 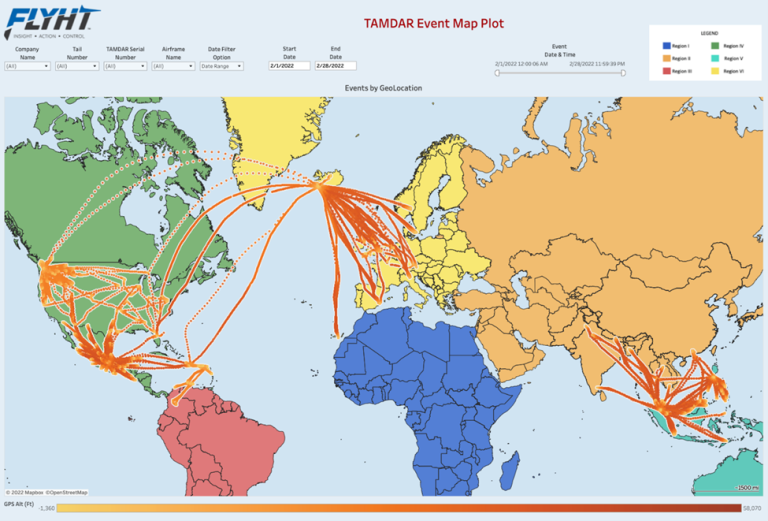
Carmen [dot] Emmel |
Aircraft-based Turbulence Observations Status within AMDARThere are two atmospheric turbulence intensity metrics currently used by the AMDAR community. The first metric is eddy/energy dissipation rate (EDR). MacCready (1964) first suggested the use of EDR as a measure of turbulence intensity. It is particularly useful operationally since EDR along the vertical direction is proportional to the RMS (root-mean-square) vertical acceleration experienced by an aircraft for any given flight condition (MacCready 1964; Cornman et al. 1995). Further, EDR has been adopted as the standard metric for atmospheric turbulence reporting by the International Civil Aviation Organization (ICAO) (2001). Before the COVID-19 pandemic, more than 1,300 aircraft were reporting EDR worldwide with an average of approximately 80,000 reports per day as of February 2020. However, as seen in Figure 1 which shows the approximate numbers of available routine EDR reports, beginning in March of 2020, a swift decline in the numbers of flights caused a drop in the EDR reporting to about 30% of pre-COVID-19 levels. Reporting recovered slowly to approximately 95% of pre-pandemic levels though with a temporary dip during the Omicron surge. Figure 2 shows the locations of available EDR reports for March 2022. Currently, just under 1,600 aircraft are reporting EDR worldwide with an average of more than 85,000 reports per day. 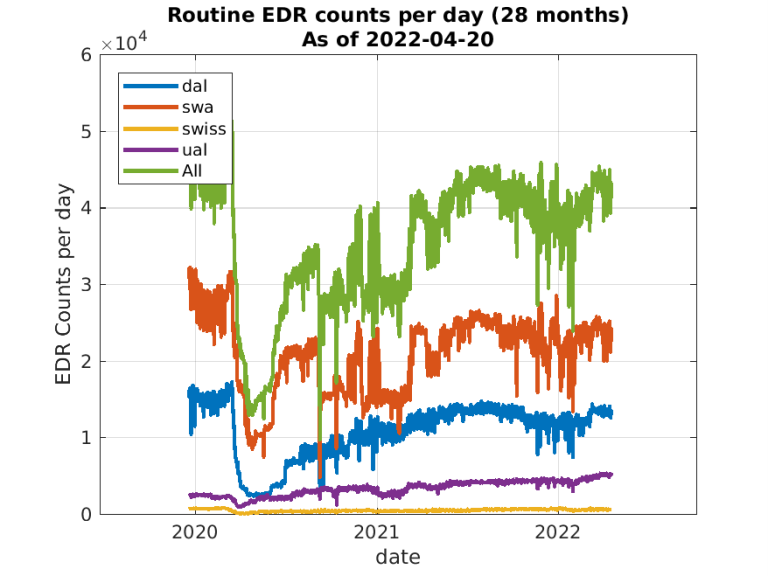
Figure 1: Counts of all available routine daily EDR reports for the previous 28 months as of April 20, 2022 broken out by reporting airline. |
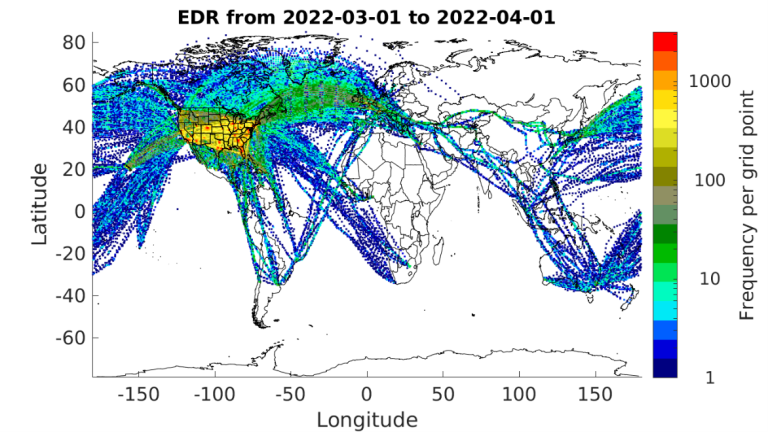
Figure 2: Counts of all available EDR reports for March 2022 using an approximately 50x50 km grid. The color scale is logarithmic. |
The second metric, derived equivalent vertical gust (DEVG), is defined as the instantaneous vertical gust velocity which, when superimposed on a steady horizontal wind, would produce the measured acceleration of the aircraft. The effect of a gust on an aircraft depends on its mass and other characteristics, but these factors are accounted for so that a gust velocity can be calculated which is independent of the aircraft. Before the impacts of COVID-19 were truly felt by the aviation industry, more than 360 aircraft were reporting DEVG worldwide averaging about 20,000 reports daily. Starting in early March of 2020, DEVG reporting also dropped significantly, down to about 15% of pre-COVID-19 levels. These numbers are based on an analysis of AMDAR data from the U.S. National Centers for Environmental Prediction’s (NCEP) Meteorological Assimilation Data Ingest System (MADIS). A large fraction (85%) of the DEVG data appears under a single tail number, which is clearly unrealistic, and thus, the estimated number of aircraft reporting DEVG is substantially underestimated. Currently, there are at least 150 aircraft (probably more than 650) reporting about 32,000 measurements per day (a more than 50% increase from pre-COVID-19 levels). Figure 3 shows the locations of all DEVG reports for March 2022. There is software-based logic implemented on many aircraft that limit reporting of DEVG in some regions at certain altitudes (e.g., Europe). DEVG reporting has increased over North America but continues to be precipitously low in the southern hemisphere with the notable exception over Australia. 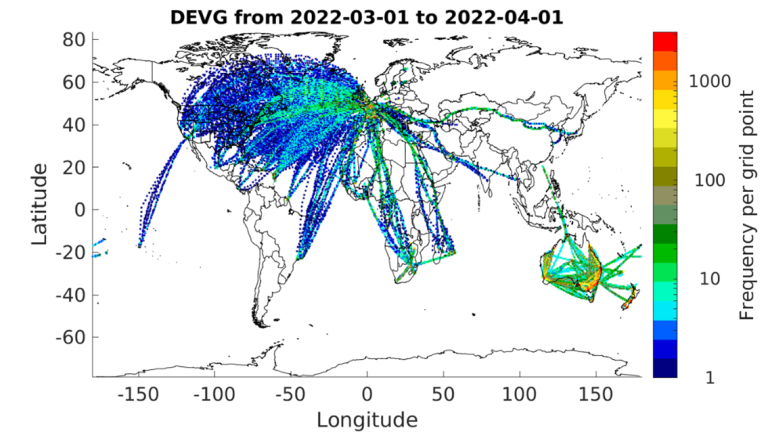
Figure 3: Counts of all available DEVG reports for March 2022 using an approximately 50x50 km grid.These maps illustrate the need for expansion of aircraft-based turbulence observations in many areas of the globe. WMO continues to work with its Members and their respective national airlines to increase aircraft-based turbulence observation coverage. WMO and its Members express gratitude to our aviation industry and airline partners for their continued contribution to the WMO Aircraft-based Observing System and the AMDAR program. The data produced from this collaboration are utilized within many meteorological applications and forecasts benefiting aviation operations and safety, other application areas and the wider general public. For more information on aircraft-based observations data statistics visit the WMO website. meymaris |
Regional Programmes Status & DevelopmentWMO Region III (South America, Central America and the Caribbean)COVID-19 pandemic effects still are impacting the South American aviation industry. Although flight availability is recovering and flight numbers are making a steady upturn, ABO data provision has decreased after December 2021 due to financial issues within the participating airlines. TT-ABO III During December 2021, the Task Team on Aircraft based Observation for Region III (TT-ABO III) approved the first ABOP Regional Implementation Program (A-RIP) document in Spanish under WMO-IATA Collaboration on AMDAR Program (WICAP). National representatives from Argentina, Bolivia, Chile, Ecuador, Colombia, Paraguay, Peru and Uruguay discussed regional matters such as WICAP centers and an upcoming virtual workshop for RA-III. The next meeting is scheduled for late spring at which task team members will plan the next steps for WICAP implementation with regional IATA representatives. Argentina (AR)-AMDAR As mentioned in the October 2021 newsletter, AR-AMDAR has suffered a very pronounced decrease and ultimate stoppage in its AMDAR data delivery after June 2020. The COVID-19 pandemic forced the LATAM Argentina branch into bankruptcy and ended its regular AMDAR data provision. Brazil (BR)-ABO The Brazilian ABO program also continues to be negatively affected by the pandemic (Fig. 1). However, ADS-C data provision shows a small but steady recovery. As a result of LATAM’s cost-cutting policies, AMDAR data processing has experienced a sharp decline since July 2021 due to the airline’s reduction of downlink data. Data service providers and LATAM itself are looking to find the best solution to keep the data flowing. 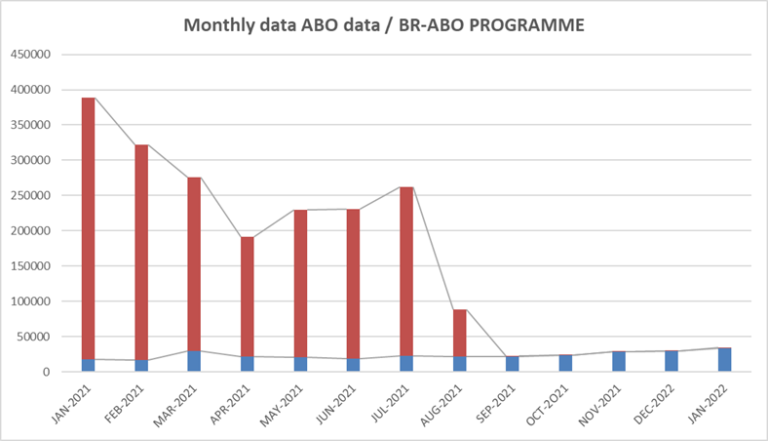
Figure 1. Brazilian ABO program data during 2020. Blue bars represent ADS-C data and red bars show AMDAR data. Source: Martim Matschinske (CTCEA/CISCEA - Brazil) |
US-LATAM Program LATAM Airlines also is struggling with COVID-19 consequences. Although pandemic-forced border closures have been lifted, the programme has endured a steady reduction in data. This is a consequence of the LATAM bankruptcy in 2020 when the company cut all support to their downlink data systems by the beginning of 2022. Numerous meetings with data service providers, NOAA and the airline persuaded LATAM to continue to deliver data. It is expected that a minimal flow of data will begin by the middle of 2022. 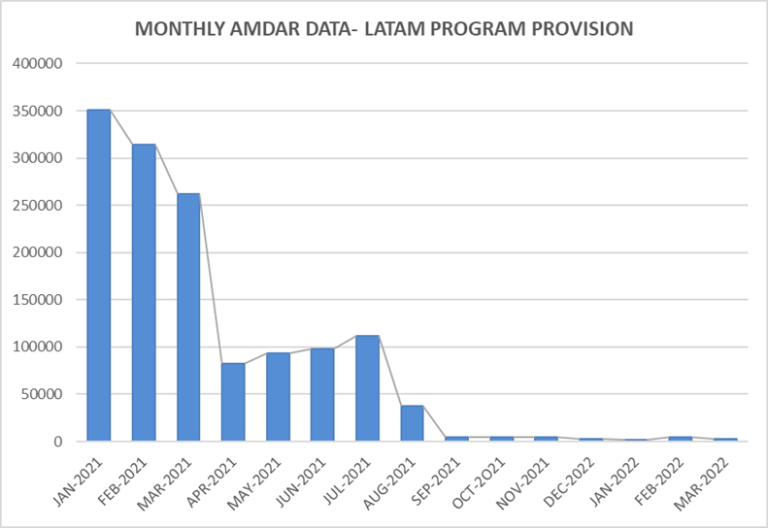
Figure 2. LATAM program. Blue bars represent AMDAR monthly data. Source: Dirección Meteorológica de Chile (DMC)nrivaben |
WMO Region IV (North America, Central America and the Caribbean)The RA-IV ABO program is comprised of
In partnership with RA-III, the USA program also provides AMDAR reports over South America from LATAM. The non-AMDAR components of the USA and Canadian programs were reviewed in considerable detail in the October 2021 (Volume 22) edition of the newsletter. COVID-19 impacts on the RA-IV program continue to be steady with data volumes from the USA program averaging, on a daily basis, around 70% of the pre-pandemic volume. However, the WVSS component continues to be near normal given the large component on cargo aircraft (please see the WVM summary article for more information on WVSS). Owing to the pandemic-related financial issues, the provision of reports from LATAM continues to be severely curtailed. We are working toward at least a partial resumption of the data at some point in the future. The Canadian AMDAR program continues to improve showing an overall ABO data volume increase (daily total observations) across the country. Canada is actively working at expanding its AMDAR program through partnerships with data providers and airlines and will soon announce an important addition to the program, a contract with Jazz Aviation LP. This arrangement will be for data from its CRJ900 fleet which could increase the total number of reporting aircraft by 150%. Implementation of new aircraft to the program should be completed by the end of calendar year 2022. More details will be communicated later this summer. The Canadian AMDAR program is pleased to announce that since March 24th 2022, the MET data from ADS-C bulletins coming from Edmonton – FIR (Flight Information Region) are now available. Currently, MET data are included on only approximatively one out of five bulletins transmitted, but starting May 19th, the data-to-bulletin ratio will be 1:1. curtis [dot] marshall |
WMO Region V (South-West Pacific)Throughout the COVID-19 pandemic, travel restrictions have limited and impacted AMDAR programmes through:
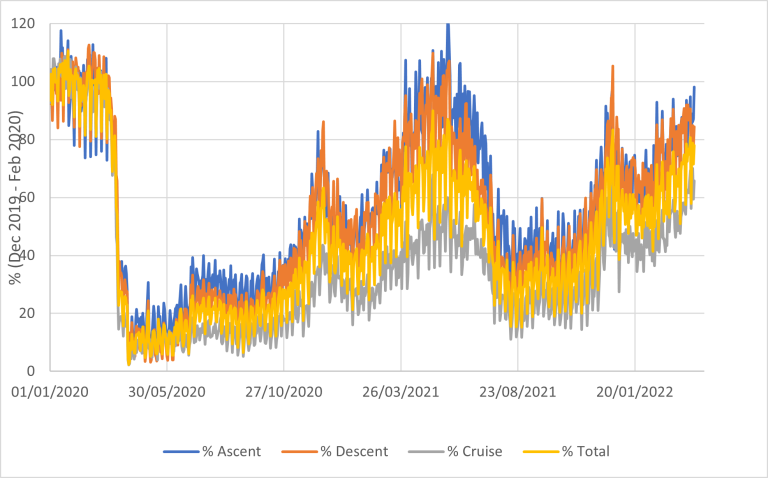
Since the start of 2022, there has been a slow reduction of domestic and international travel restrictions (and increase in public confidence in COVID-19 travel safety) across RA-V leading to an increase in AMDAR observations as demonstrated by the data from the New Zealand and Australian programmes shown below. 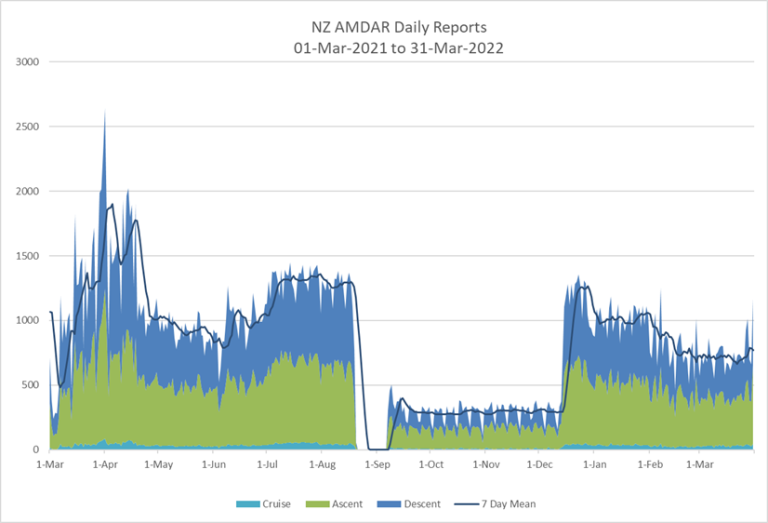
|
Against the trend for reduced development activities because of COVID-19, the NZ MetService has been working with Air New Zealand to improve the reporting algorithm for their A321 Fleet so that it utilises flight number (rather than aircraft registration) giving greater flexibility to control spatial and temporal reporting and reduce duplication. A RA-V Expert Team on the WMO-IATA Collaborative AMDAR Programme (ET-WICAP) is expected to be formed shortly. douglas [dot] body |
WMO Region VI (Europe)The period January-March 2022 has shown a steady increase in AMDAR data generated across Europe with a significant jump in numbers during last week of March which corresponds to the start of the airline summer schedules. As the figure below shows, for the first time in two years, we are approaching pre-COVID-19 data levels of over 50,000 daily AMDAR observations. 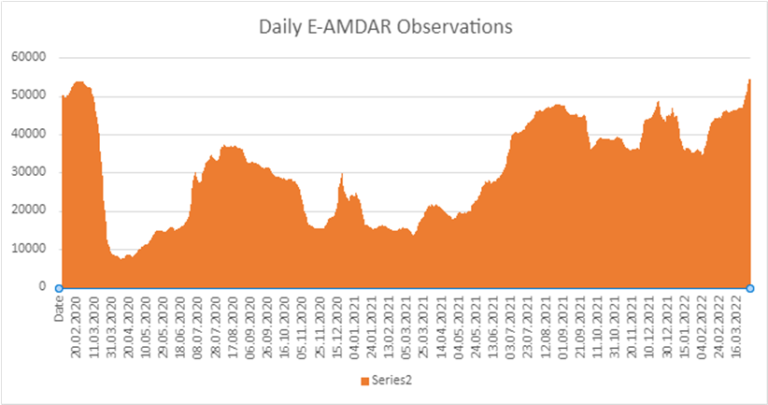
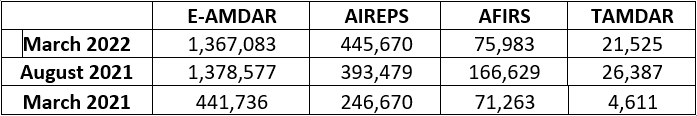
With this increase in data, performance criteria have improved over the period including the number and distribution of airports covered. With the general expansion shown by European airlines, we are optimistic aircraft data coverage to be back to ‘normal’ levels from now onwards. This also includes the few water-vapour observing aircraft which have seen a dramatic and unexpected increase with Lufthansa returning seven out of nine WVSS aircraft into service earlier than expected (see SG-WVM report). In terms of overall numbers of all types of ABO collected for users within the EUCOS area, the following totals for March 2022 are a big step up from those during March 2021. The exception has been AFIRS which, unfortunately, has been impacted by the Ukraine/Russia conflict (see below). |
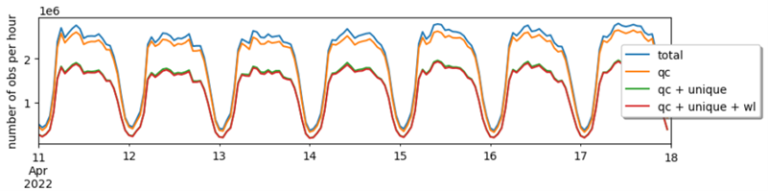
The number of European Mode-S observations being generated also has risen and from the figure below, EMADDC is at maximum receiving nearly three million observations per hour of which close to two million quality-controlled observations are being generated and made available to users. |
Despite airline optimism and the increase in data, airlines still only are concentrating on survival and are by no means returned to full strength. This is borne out by numerous reported flight cancellations driven by COVID-19-related staff absences. Apart from flight crew shortages, the engineering and support teams are also still understaffed meaning only essential issues will be addressed. Consequently, we are not expecting planned additions to the European AMDAR fleet to materialize for perhaps another year, although this will not prevent us from trying to speed up the process! One exception is the Polish airline, LOT, that has signed an agreement to develop and implement AMDAR reporting on its Embraer fleet. This is a significant step towards achieving AMDAR reporting from the smaller regional airports across Europe. While we haven’t been able to increase the number of aircraft reporting over the last two years, we have established basic 24/7 monitoring of the European AMDAR data processing system. Previously, monitoring only has been possible during normal ‘office hours,’ but with this development, any issues should be identified sooner meaning any data outages should be minimized. An important step in the development of the European Meteorological Aircraft Derived Data Centre (EMADDC) has taken place with the termination of EMADDC release 1.6 (R1.6). R1.6 was the first operational version of EMADDC and was used to process and distribute the EUROCONTROL MUAC Mode-S EHS derived data. EMADDC R2.1, that was made operational at the start of the COVID-19 pandemic, also will be terminated by mid-May of 2022 and will be replaced by version R2.2 that uses improved algorithms for quality control and has a somewhat expanded geographical coverage. Operational users were informed of these changes in 2021. The EMADDC website is another outlet that has moved forward and now provides a comprehensive source for daily/weekly/monthly performance data as well as information on how to participate in EMADDC activities. (see https://www.emaddc.com/default.aspx) The Ukraine/Russia conflict, which began in February 2022, brought about subsequent flight bans and the loss of most ABO data over Ukrainian and Russian airspace as can be seen in the comparative figures below which show European data coverage before and after the 24th February 2022. As mentioned above, it would appear that AFIRS data coverage over Russian airspace is similarly impacted, which we hope only will be temporary. The effect of this reduction in coverage on NWP is currently unknown. |
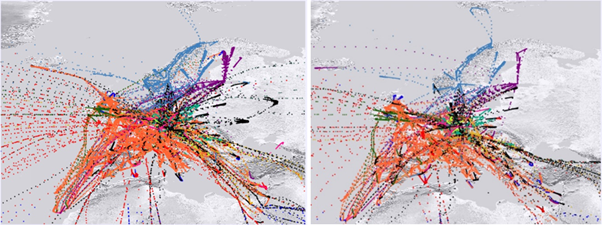
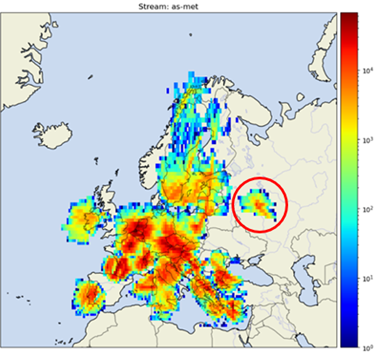
Central European AMDAR coverage before and after 24th February 2022The one exception is that we are still receiving some private network Mode-S data being generated around Moscow (circled below, 13th April 2022). |
The RA-VI TT-ABO has met twice during the last six months to develop the workplan for the RA-VI A-RIP and RA-VI WICAP Implementation Plan. Both plans were approved at the RA-VI-18. The current activities are focussed on developing Mode-S data reception and processing across the whole region which, apart from the activities of EMADDC, includes a Russian Federation trial of accessing Mode-S MRAR data around Pulkovo Airport (St. Petersburg) between 2020 and 2021. The Commonwealth of Independent States Interstate Committee for Hydrometeorology of the (CIS ICH) has agreed to coordinate ABO activities in the east, including developing AMDAR (through WICAP), much as EUMETNET currently does for western Europe. steve [dot] stringer |
Development of the WMO-IATA Collaborative AMDAR Programme (WICAP)Over the past six months, the Coordination Group on WICAP (CG-WICAP), a sub-group of the Joint Expert Team on Aircraft-Based Observing Systems (JET-ABO), has been working on the WICAP Target Airline Analysis. This work includes the development of guidance and promotional material for WICAP and finalization of the legal arrangements in the form of a template which outlines an operator/airline agreement for WICAP participation. The report of the WICAP Target Airline Analysis includes an airline assessment and a recommended and prioritized plan for the target airlines as a basis for WICAP implementation over the coming five years. The regional WICAP target airlines were identified by the ABO region leads based on an evaluation of each airline’s technical capabilities to collect and report AMDAR data. The results of a questionnaire determining a target airlines readiness to join AMDAR led to an estimate of the developmental and operational costs to participate in the program. These results were presented as recommendations, strategies and activities for the successful implementation of WICAP and are available through the WMO Community Platform. The analysis results were the basis for a brainstorming session on the future aims of WICAP which was held at WMO headquarters in Geneva on 23rd March 2022. The meeting participants agreed to two key aims for the collaborative programme for 2022-23,
CG-WICAP has been working to develop guidance and promotional material for the programme. Two videos, Introduction to WICAP and Benefits of WICAP, give basic information about the programme and are published on the WMO Community Platform. The videos can be used as introductory or educational material for airlines and NMHSs. The WICAP Airline Manual is designed to be a roadmap for airline participation in WICAP by enhancing the knowledge of airline financial and operational decision makers with information about starting or expanding AMDAR reporting. It provides airlines with the essential information about WICAP and the AMDAR programme with the objective being to meet a growing global need for aircraft data that improves airline operations. The manual is expected to be published by July 2022. A series of WICAP flyers describing the programme requirements and benefits as well as summarizing the process for joining the programme will be produced. Among the developments described above, CG-WICAP continues to support the establishment and growth of regional AMDAR programmes, planning under WMO Regional Associations and dialog between NMHSs and national airlines focusing on areas lacking upper-air data. mhuuskonen |
Uncrewed Aircraft Systems Demonstration Campaign | |
| Under the Joint Expert Team on Aircraft-Based Observing Systems, development of the scope and terms of reference of the WMO Uncrewed Aircraft Systems Demonstration Campaign (UAS-DC) continues. The UAS-DC is expected to be held over the March to August 2024 and, as was reported in the last Newsletter, aims to demonstrate the capability of UAS to provide data of sufficient quality and reliability on a routine operational basis in support of meeting requirements for upper-air observations as a component system of the WIGOS Global Basic Observing Network (GBON). | 
|
The holding of the campaign was recently reported in the WMO MeteoWorld, March 2022 edition, in the article, Call for Participants: WMO Uncrewed Aircraft Systems Demonstration Campaign. This follows the endorsement by the WMO Commission for Observation, Infrastructure and Information Systems (INFCOM) Management Group of the the scope and plan for the campaign, that has been developed under the INFCOM, UAS-DC Scoping Planning and Organising Committee (SPOC). Progress so far over 2021 and 2022 has included:
In the coming months, development work will focus on:
The next meeting of participants in the UAS-DC is scheduled to take place on 5 May 2022. The uas-demo | |
Upcoming ABO Meetings & Events | |
UAS Demonstration Campaign, 2nd Meeting of Participants, 5 May 2022The second Meeting of Participants in the WMO UAS Demonstration Campaign will be held virtually on 5 May 2022 from 1400 to 1530 UTC. Meeting details will be available on the UAS-DC Community Platform site. | |
JET-ABO Second Meeting, 27 - 30 June 2022 - Geneva, Switzerland & VirtualThe second formal meeting of the WMO Infrastructure Commission, Joint Expert Team on Aircraft-Based Observing Systems (JET-ABO) will be held over 27-30 June 2022. The meeting will be a hybrid meeting conducted both in person at WMO headquarters in Geneva, Switzerland and virtually, with team members able to attend remotely by videoconference. Meeting agenda, documents and videoconference details will be available from the JET-ABO-2 meeting site on the WMO Community Platform. The JET-ABO-2 meeting will focus on a range of team activities and tasks including:
Invitations to team members to attend will be sent in early May. | |
JET-ABO, Workshop on Aircraft Derived Data, 5-7 September 2022, Geneva, Switzerland & VirtualThe JET-ABO will coordinate a WMO Workshop on Aircraft Derived Data to take place in Geneva, Switzerland as a hybrid (in person and virtual) event, over 5-7 September 2022. The aims of the workshop are: To raise awareness and share best practices on the potential opportunities and use of aircraft derived data in the meteorological domain.
Workshop information will be available on the WMO Community Platform, Aircraft-Based Observations site. The workshop presentations will be recorded and made available online following the workshop. Member experts and WMO National Focal Points on Aircraft-Based Observations will be contacted later in the 2nd quarter of 2022 to invite their attendance, either in person or virtually. | |
Please contact the dlockett wmo [dot] int (WMO Secretariat) for further information on WMO meetings and events. wmo [dot] int (WMO Secretariat) for further information on WMO meetings and events. | |
Using AMDAR Data in Atmospheric Boundary Layer Research: Application over the Santiago Valley in Central ChileCommercial aircraft-based meteorological data have increased significantly the temporal and spatial availability of atmospheric information in the vertical as compared to the traditional radiosonde observations. The first and most direct application of these new observations is their assimilation into global weather forecast models for which a very positive impact is well documented. Another less established application of these data is in atmospheric boundary layer (ABL) research. The ABL is defined as the lowest region of the atmosphere where surface effects such as heating/cooling, evaporation, air pollutant emissions and friction are rapidly and strongly felt. As such, the study of ABL dynamics is important in matters like air pollution and wind energy. Perhaps the most important variable in ABL studies is the ABL height (H) which has strong temporal and horizontal variability. Estimates of H can be made from costly surface-based remote sensing instruments or from vertical profiles of temperature and winds. In this latter approach, the aircraft-based meteorological observations around busy airports offer the possibility of characterizing the ABL with detailed time resolution and long-term data records. It must be pointed out that, despite being assimilated into global models, the ABL information provided by these data typically is lost in the reanalysis products due to the relatively low resolution of the models and, therefore, analysis of the raw data is crucial for this application. This article summarizes findings presented in a paper by Muñoz et al., entitled “Using Commercial Aircraft Meteorological Data to Assess the Heat Budget of the Convective Boundary Layer Over the Santiago Valley in Central Chile” published online in January 2022 in the journal Boundary-Layer Meteorology. AMDAR data from the Santiago International Airport (SCEL) was used to characterize the dynamics of the ABL over the Santiago valley in central Chile (Lat. 33.5°S, Lon. 70.7°W, Altitude 500m ASL). The valley has a very stable subtropical semi-arid climate and a distinct topographical confinement thanks to the Andes Cordillera to the east and the Coastal Range to the west (Figure 1). 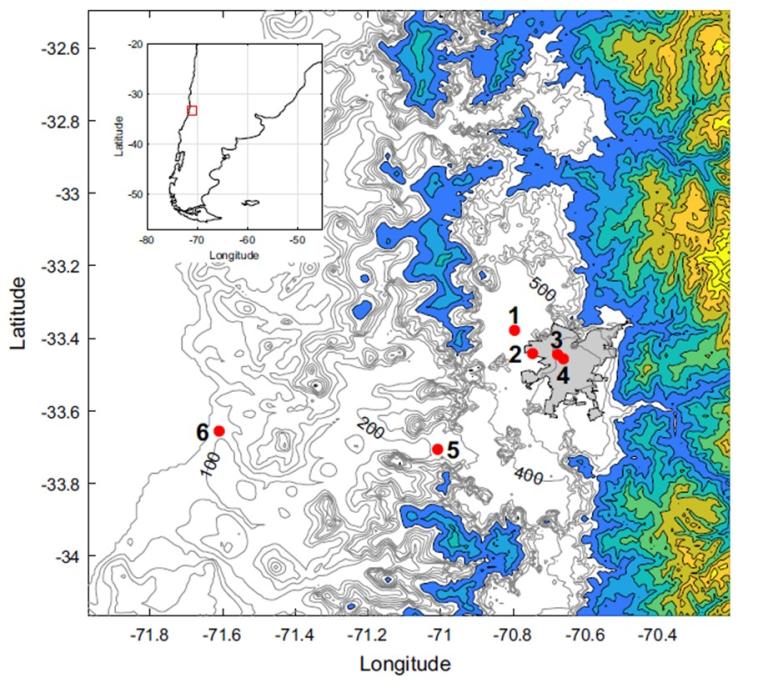
Figure 1. Topographic map of Santiago valley and surroundings (taken from Fig. 1 of Muñoz et al., [2022]). Line contours from 0m to 800m every 100m and colored contours from 1000m to 5000m every 500m. Point 1 marks the location of the Santiago International Airport (SCEL). Point 6 at the coast is the location of radiosonde station SCSN. Gray shaded area marks the urban extension of Santiago city. Inset shows the study region in the southern portion of South America.AMDAR data were downloaded from the NOAA ESRL/GSD website. Figure 2 shows the monthly data availability for SCEL from 2003 to 2021. |
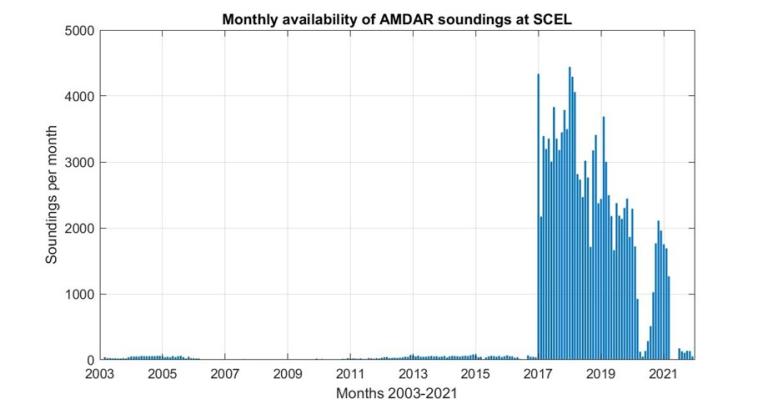
Figure 2. Monthly availability of AMDAR soundings for Santiago International Airport (SCEL) from 2003 to 2021 as downloaded from the ESRL-GSD website. |
The abrupt increase in data availability in 2017 was due to the South American LATAM airline group joining the AMDAR program. The reduced availability in 2020 is due to the COVID-19 pandemic and the abrupt decline after march 2021 results from LATAM leaving the AMDAR program because of financial constraints. We focused our analysis to the April-September period of years 2017-2019 when an average of four soundings per hour were available and vertical profiles for 89% of the hours could be produced. Specific pre-processing of the profiles and quality filters were applied in order to optimize the data for ABL purposes. In the first part of the paper, vertical profiles of AMDAR winds and temperatures in the lower troposphere were compared against three other sources of vertical meteorological information: 33 radiosondes launched occasionally in the valley, routine radiosondes launched at the coast about 100km west of Santiago (SCSN station) and vertical profiles obtained from the commonly used ERA5 reanalysis. The purpose of the analysis was to show that the AMDAR data compare very well with the traditional radiosonde observations taken in the valley and that they provide ABL information that is not found either in the coastal radiosondes or in the reanalysis. To illustrate this last point, Figure 3 shows mean 0800LT vertical profiles of temperature and wind components for SCEL AMDAR data, SCSN radiosondes and ERA5 reanalysis. While above 1000m all observations are very similar, the deep temperature inversion in the valley shown by the AMDAR data is absent both in the reanalysis as well as in the coastal radiosondes. 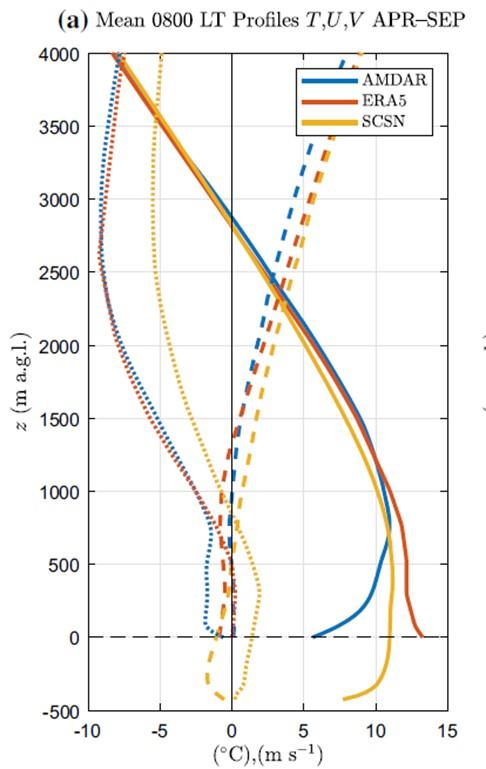
Figure 3. Mean vertical profiles of temperature (solid), zonal (dashed) and meridional (dotted) winds obtained from AMDAR (blue), ERA5 reanalysis (red) and SCSN routine radiosondes (yellow). The period considered in the averages is April-September 2017-2019 at 0800LT (taken from Fig. 4 of Muñoz et al. [2022]). |
The second part of the paper included a description of the cold-season climatology of AMDAR temperature and wind profiles below 2000m AGL (Figure 4) and a validation of daytime ABL heights derived from them. 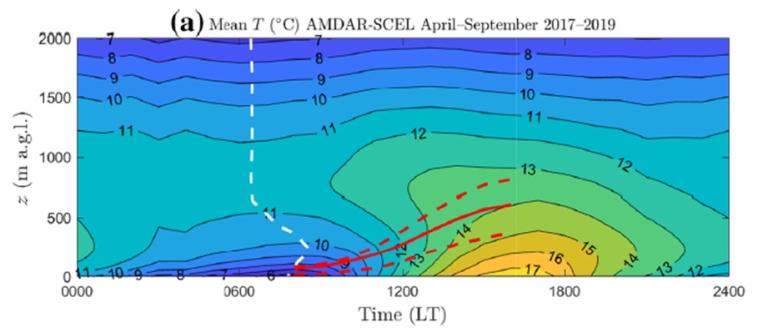
Figure 4. Mean diurnal cycle of temperature in the 0m-2000m AGL vertical range over the Santiago valley for the April-September period from years 2017-2019 (taken from Fig. 5 of Muñoz et al. [2022]). Red lines mark the distribution of ABL heights derived from AMDAR data and the white line marks the time of minimum temperature at each height. |
Based upon the ABL heights and temperatures, we computed the heat used in warming the daytime ABL between 0800LT and 1600LT daily and compared this with the surface sensible heat flux estimated with sonic anemometer data available at one site in the valley. A large number of days (372) were used in the comparison and the correlation obtained was remarkably high (r = 0.9) as long as the effect of the advection of cool air from the coastal ABL was taken into account (Figure 5). 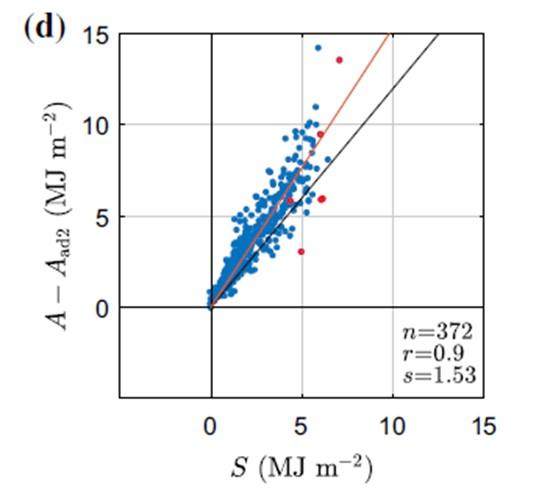
Figure 5. Scatter plot of daytime heating amounts provided by the surface (abscissa) and net warming of the Santiago valley ABL (ordinate) (taken from Fig. 10 of Muñoz et al. [2022]). Black line shows the expected relationship under free convective conditions and red line shows the observed regression. |
An intriguing result showed that the ABL daytime heating accounted for about half of the total daytime heating of the lower troposphere, raising the question of the mechanisms explaining the other half. Mesoscale subsidence induced by the regional topography was proposed as an explanation for the missing heat but further data analysis and numerical modeling of the Santiago valley ABL will be needed to confirm or discard this hypothesis. The semi-continuous temporal coverage and extended data records of the AMDAR profiles produced in the vicinity of major airports constitute an idealized dataset with which to describe the climatology and dynamics of the ABL. AMDAR data in the form of vertical profiles associated with each aircraft landing or take-off are best suited for ABL analyses. Data provided in the ESRL/GSD format are most useful in performing these analyses. Also, pre-processing of the data and special filters need to be implemented to assure that the final database adequately describes the ABL at the specific site considered. We believe that the work presented in the paper demonstrated the value of AMDAR data to investigate ABL dynamics. Hopefully, in the future, LATAM will rejoin the AMDAR program as it provides a wealth of upper-air information over a continent with limited alternative sources of such crucial meteorological data. Reference: Muñoz, R., C. D. Whiteman, R. Garreaud, J. Rutllant, and J. Hidalgo, 2022: Using Commercial Aircraft Meteorological Data to Assess the Heat Budget of the Convective Boundary Layer over the Santiago Valley in Central Chile. Accepted in Boundary-Layer Meteorology. rmunoz |
AMDAR Observations of the 20 October 2019 Tornado Outbreak in Dallas, Texas, USADuring the evening of 20 October 2019, a severe weather outbreak swept across the Dallas / Fort Worth, Texas metropolitan area. This event, which produced damaging winds, large hail and numerous tornadoes, was the costliest in Texas history. Unlike many previous outbreaks, this system formed over a major center of American commercial aviation during peak flight hours and was documented by AMDAR observations to an extraordinary degree. Results presented here show how AMDAR observations can be used to monitor the thermodynamic and kinematic instability of a major severe weather event from before cell initiation to well after severe impacts are experienced. The Dallas/Fort Worth metropolitan area, commonly called the Metroplex, is home to over seven million people, the fourth most populous in the U. S., and is served by two significant commercial airports that connect the region both nationally and globally. Dallas/Fort Worth International (KDFW) is the fourth-busiest airport in the U. S. with nearly 2000 aircraft movements daily in 2019 (the most recent year unaffected by the pandemic). Nearby Dallas Love Field (KDAL) had more than 600 daily movements. Through expert flight planning and air traffic control, these airports were able to handle large numbers of arriving and departing aircraft on 20 October 2019 despite the supercell thunderstorms propagating through the area. This allowed for dozens of AMDAR profiles of the environment before and after convective initiation and even during the severe weather. Since KDAL is the home base for Southwest Airlines, which operates the world’s largest WVSS-equipped fleet, frequent water vapor profiles were also available. When combined, these AMDAR observations create a comprehensive and unique portrait of the evolution of the thermodynamic instability and kinematic structure of the atmosphere during this event. The synoptic conditions in the region on this day were dominated by a deepening trough across the southern Great Plains which provided upper-level dynamical instability and contributed to wind shear. Predominantly southerly flow across Texas advected elevated surface dew point temperatures into the region which enhanced thermodynamic instability. An advancing dry line was anticipated to provide sufficient lift to initiate convection. Although it was clear that severe weather would form in northern Texas and southern Oklahoma, the specific threats and locations that would experience the strongest impact remained unsure in that morning’s forecasts. One challenge facing forecasters was ascertaining if a sufficient quantity of low-level wind shear was present to support discrete supercells, or if a high-instability / low shear environment would sustain the development of a Quasi-Linear Convective System (QLCS) instead. Forecasters initially predicted that the most significant convection would occur closer to the border between Texas and Oklahoma, well north of the Metroplex. However, substantial convection initiated farther south of that area and rapidly evolved into supercells. The first tornado watch covering the metro area was issued at 0058 UTC (19:58 Central Daylight Time, GMT – 5). At 0158 UTC, exactly one hour after this tornado watch was issued, the first and most destructive tornado of the evening touched down just six km northwest of KDAL. It was rated EF-3 on the Enhanced Fujita Scale (corresponding to winds between 218 and 266 km/hr), traveled for over 25 kilometers and at its maximum was 1.2 km wide. This tornado alone caused over 1.5 billion USD in losses to numerous communities including damaging multiple schools, several churches and many businesses. As a testament to the effectiveness of the National Weather Service and this region’s familiarity with proper actions during severe weather, no lives were lost. Monitoring the evolution of wind shear and thermodynamic instability before and during severe weather events can be difficult or impossible using only conventional observations. Like many other countries, the United States launches radiosondes prior to the nominal synoptic times of 0000 and 1200 UTC. At DFW, the 6:15 and 18:15 CDT launch times are not particularly well-suited for severe weather nowcasting since the morning profiles are dominated by residual nocturnal inversions from the night before and the evening data often capture the environment after storms have already initiated. Furthermore, the twelve-hour gap between successive launches makes it impossible to know how rapidly and intensely the atmospheric structure is changing on the short time scales that are important for severe weather processes. The Dallas tornado event illustrates the value of frequent AMDAR observations in understanding, monitoring and forecasting the evolution of severe storm environments. Although commercial aircraft generally avoid penetrating convective cells directly, normal air traffic control operations prior to storm formation and expert flight routing to avoid individual storm cells result in hundreds of near-storm profiles, orders of magnitude more than can be observed by radiosonde. Figure 1 shows the flight tracks of AMDAR-reporting aircraft superimposed on reflectivity snapshots from the National Weather Service Doppler radar at Fort Worth. The aircraft aligned to the north/south runways at KDFW or the northwest/southeast runways at KDAL are in the process of either taking off or landing and provide valuable low-level observations in the process, even as strong storms pass nearby. For this event, a total of 368 AMDAR profiles were available in the nine hours prior to tornado touchdown. Moisture observations were present in 25 profiles during that time. 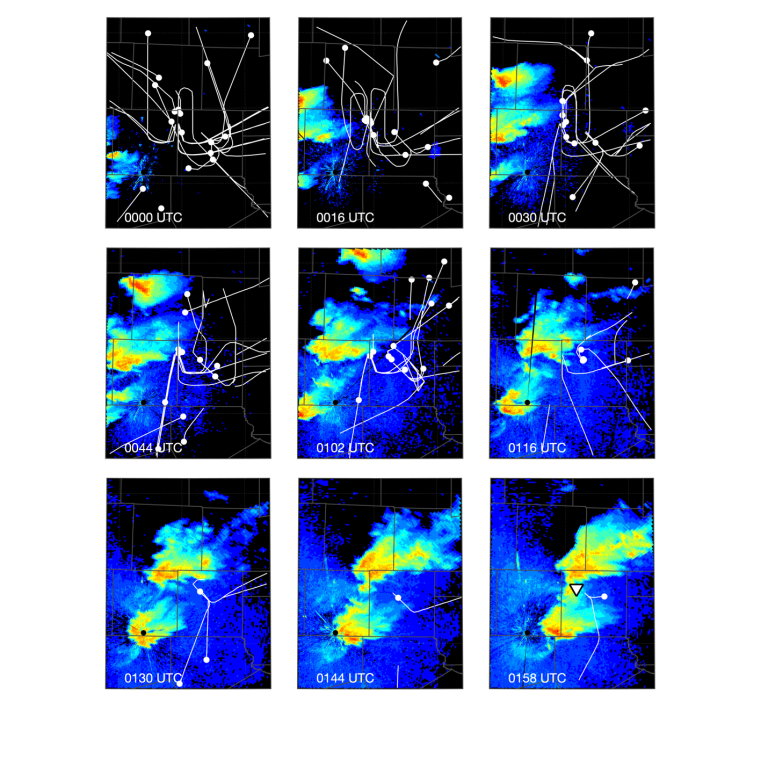
Figure 1: Radar reflectivity from the Fort Worth, Texas National Weather Service Doppler radar with flight tracks (lines) and most recent position (dots) of AMDAR-equipped aircraft. The final panel, at 0158 UTC, corresponds to the time of the first and most significant tornado which is indicated with a white triangle. |
Although the mesoscale moisture structure and its changes are critical for predicting storm growth, information from the large number of AMDAR reports of temperature and wind can be important in determining probable storm type. Figure 2 shows the Storm-Relative Helicity (SRH) as calculated solely from AMDAR wind observations. SRH is a measure of the atmosphere’s ability to support rotating updrafts through environmental wind shear, with elevated levels of SRH being essential for fostering long-lived supercell storms. SRH typically is calculated over two depths, from 0 – 1 km and 0 – 3 km. For this case, 0 – 1 km SRH remained below 200 m2s-2 throughout much of the afternoon, values that are typically considered marginal for supporting supercells. However, the fact that 0 – 3 km SRH is only slightly higher indicates the bulk of the shear is adjacent to the surface, a factor that is beneficial for supercell formation. After 2200 UTC (17:00 local time), both the 0 – 1 and 0 – 3 SRH values show consistent increases in nearly 100 independent AMDAR reports. By 0000 UTC, helicity values are at or above 300 m2s-2 indicating strong support for supercell formation – notably larger than that shown by the 2315 UTC radiosonde data. Within approximately 30 minutes before the tornado forms, SRH values are approaching 500 to 600 m2s-2, nearing 1000 m2s-2 immediately before touchdown. Again, the observations show that the majority of the wind shear is in the lowest kilometer, a layer which is crucial for supercell development and, coincidentally, includes 10 to 20 reports from each AMDAR aircraft. Although initial forecasts were unable to anticipate the significant helicity present in this environment, the AMDAR observations were able to fill in the large temporal gap between radiosonde launches and reliably detect the increase in wind shear during the pre-convective hours. 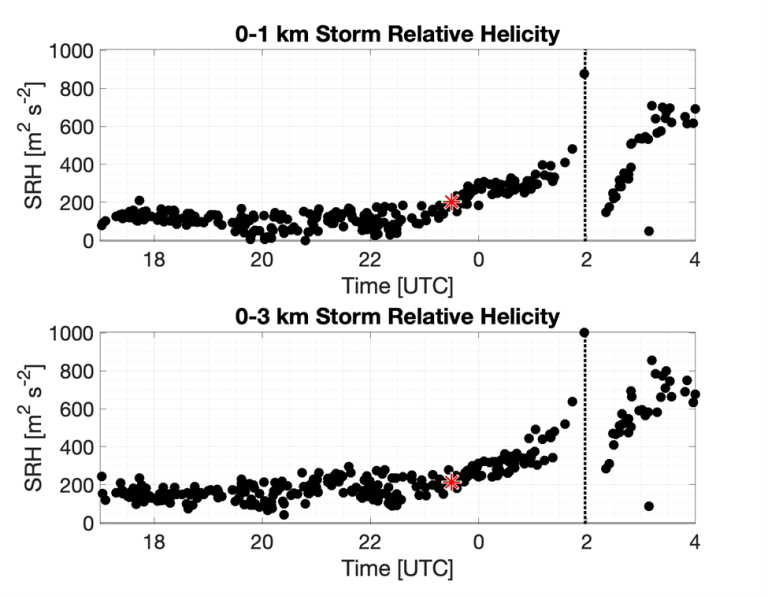
Figure 2: Time series of AMDAR-observed 0 – 1 km storm-relative helicity (top) and 0 – 3 km storm-relative helicity (bottom). Red asterisks note the observed values from the Fort Worth, TX radiosonde. The dashed vertical line at 0158 UTC represents the time of the formation of the first tornado of the outbreak. |
While the fraction of the air fleet that hosts WVSS-II moisture observations remains small, KDAL’s role as a major center of operations for Southwest Airlines and its fleet of WVSS-equipped aircraft gives this case a unique opportunity to monitor the evolution of thermodynamic stability parameters with airborne observations. Figure 3 shows the time series of three key thermodynamic stability indices: the Lifted Index (LI), Convective Available Potential Energy (CAPE) and Convective INhibition (CIN). LI is the simplest of the three and measures the difference between the observed temperature at 500 hPa and the temperature of a mixed-layer near-surface (lowest 100 hPa) parcel lifted to the 500 hPa level. The more negative the LI, the more convectively unstable the environment. WVSS is well-suited to monitor the LI as almost all flights reach the 500 hPa level (approximately 5.5 km or FL180). CAPE is more comprehensive and represents the integrated positive buoyancy throughout the entire depth of the atmosphere beginning at the level of free convection, where air parcels rise on their own without being further heated or mechanically lifted, and ending at the equilibrium level, where those rising air parcels are now at the same temperature as the environment. Because the equilibrium level is typically in the stratosphere and since aircraft rarely, if ever, fly above the equilibrium level, the standard atmosphere was used to augment the aircraft reports above cruise level in these calculations. Fundamentally, CAPE represents the maximum amount of buoyant energy that a parcel can convert to kinetic energy during its ascent. The higher the CAPE, the faster the parcels rise and the more energy the storm contains. CIN represents the negative buoyant energy between the surface and the level of free convection that inhibits parcels rising from the surface prematurely. This is commonly referred to as a cap that must be broken for deep moist convection to take place. 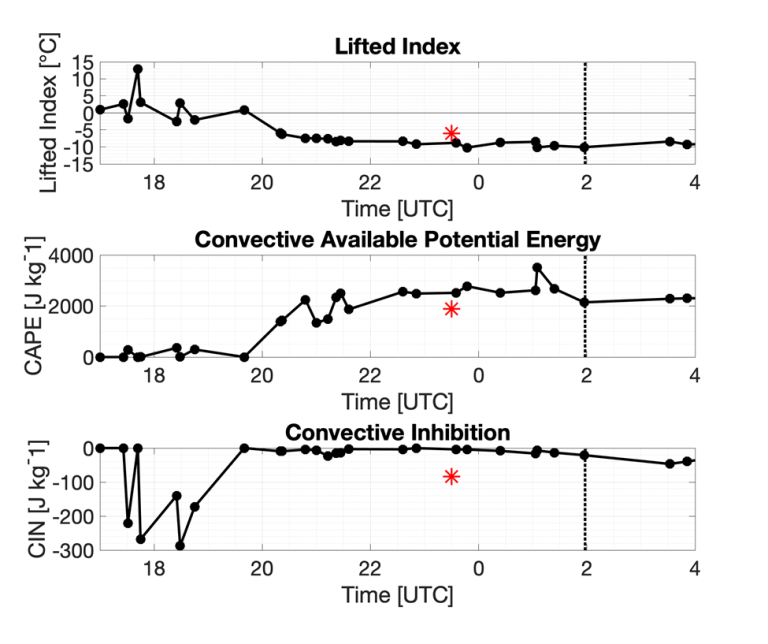
Figure 3: Time series of mixed-layer stability indices from WVSS-II-equipped aircraft. Red asterisks note the value calculated from the Fort Worth, TX radiosonde. |
It is important to note that conditions favorable for supercell and tornado formation continued well after the initial tornado. While the first tornado of the evening was the strongest, numerous additional tornadoes formed until approximately 0400 UTC (23:00 local time). Throughout this time, the AMDAR observations continued to indicate that this environment was capable of supporting these severe weather trends. While the number of observations decreased due to the nighttime reduction in flights, the remaining observations indicated that elevated levels of instability and shear were present for many hours after the first storm. While weather agencies across the globe appreciate the benefits of AMDAR and WVSS-II data for improving numerical weather prediction, the observations of the 20 October 2019 tornado outbreak show how operational forecasters also can benefit from using these reports when available. No other observing system is capable of producing in situ observations of helicity and convective instability at such fine temporal scales and even though aircraft typically do not penetrate severe convective cells, they still provide many useful observations of the near-storm environment. To realize the full value of these observations, novel methods for easily displaying these data at forecast offices and routinely integrating them into the forecast process should be developed and implemented. Timothy J. Wagner and ralph [dot] petersen |
Contacts | |
WMO INFCOM, Joint Expert Team on Aircraft-Based Observing Systems Contacts Chair Vice-chairs nrivaben | WMO AMDAR Observing System Newsletter Editor ceweiss1949 WMO Aircraft-based Observations dlockett mhuuskonen |